A circle graph shows students' favorite subjects. If \(35\%\) prefer Math and the school has \(260\) students, how many students prefer Math?
- \(35\)
- \(65\)
- \(91\)
- \(169\)


Students will build Grade 7 mastery of circle graphs using models, equations, and test-style reasoning.
A circle graph shows students' favorite subjects. If \(35\%\) prefer Math and the school has \(260\) students, how many students prefer Math?
A circle graph displays energy usage in a household. Heating accounts for \(45\%\) of the energy. If the total monthly energy is \(500\) kWh, how much energy is used for heating?
In a circle graph of sports preferences, \(20\%\) of the \(180\) surveyed students prefer soccer. How many students prefer soccer?
A percent can be converted to an angle in a circle graph. What angle corresponds to \(25\%\) of a circle?
A circle graph shows how a family spends its monthly budget. Rent is \(30\%\), food is \(25\%\), utilities is \(15\%\), and savings is \(30\%\). Which categories tie for the largest sector?
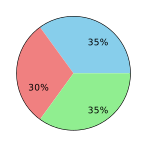
The circle graph above shows favorite types of cuisine at a restaurant. Blue represents Asian, red represents Italian, and green represents Mexican. If \(400\) customers were surveyed, how many prefer Italian?
A survey asked \(150\) people about their favorite ice cream flavor. The circle graph shows vanilla is \(40\%\), chocolate is \(35\%\), and strawberry is \(25\%\). How many people prefer chocolate?
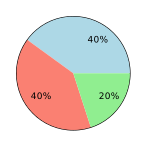
The circle graph shows the results of a survey on transportation methods. Blue is cars (\(40\%\)), salmon is buses (\(40\%\)), and green is bicycles (\(20\%\)). If \(500\) people were surveyed, how many use bicycles?
\(35\%\) of \(260=0.35\times260=91\) students.
\(45\%\) of \(500 = 0.45 \times 500 = 225\) kWh.
\(20\%\) of \(180 = 0.20 \times 180 = 36\) students.
\(25\%\) of \(360° = 0.25 \times 360° = 90°\).
Rent and Savings are both \(30\%\), the largest percentage. Food is \(25\%\) and utilities is \(15\%\).
Red (Italian) is \(30\%\) of \(400 = 0.30 \times 400 = 120\) customers.
\(35\%\) of \(150 = 0.35 \times 150 = 52.5\) people.
\(20\%\) of \(500 = 0.20 \times 500 = 100\) people.
