Testinar Grade 7 math

Comparing Populations with Measures of Center and Variability

Students will build Grade 7 mastery of comparing populations with measures of center and variability using models, equations, and test-style reasoning.

CH08-04 Statistics
Name
Date
Score
____ / 8
Directions Solve each problem. Show your reasoning on the page or on separate paper. Check the answer key only after finishing.
  1. Store A has a mean daily sales of \($450\) with a MAD of \($30\). Store B has a mean of \($480\) with a MAD of \($90\). Which conclusion is best supported?

    1. Store A typically sells more than Store B
    2. Both stores are equally consistent
    3. Store B typically sells more, but with less consistency
    4. Store B's sales are more predictable due to lower MAD
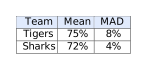
  2. Two basketball teams' free-throw percentages over 10 games are shown below. Based on this data, which statement is most accurate?

    Comparing Populations with Measures of Center and Variability visual for G7-C08-T04-Q002
    1. The Sharks are more reliable free-throw shooters
    2. The Tigers never miss a free throw
    3. The Sharks score more points overall
    4. Both teams have the same consistency
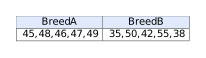
  3. The weights (in pounds) of two dog breeds are recorded: Which breed has more consistent weight?

    Comparing Populations with Measures of Center and Variability visual for G7-C08-T04-Q003
    1. Breed A (mean 47, smaller spread)
    2. Breed B (larger sample size)
    3. Both have equal consistency
    4. Cannot determine from the data
  4. Two groups of students took a math test. Group 1: mean = 82, median = 85. Group 2: mean = 82, median = 80. What does this tell us?

    1. Group 1 has higher scores in the upper half
    2. Group 2 performed better overall
    3. Both groups are identical
    4. Group 1 has outliers on the low end
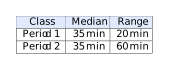
  5. A teacher recorded the number of minutes students spent on homework: Which class has more variable homework times?

    Comparing Populations with Measures of Center and Variability visual for G7-C08-T04-Q005
    1. Period 1
    2. Period 2
    3. Both are equally variable
    4. The data does not support comparison
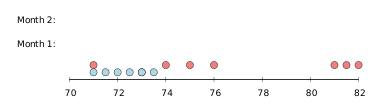
  6. The dot plots below show the daily temperatures (in \(°\)F) for two months: Which month is more consistent in temperature?

    Comparing Populations with Measures of Center and Variability visual for G7-C08-T04-Q006
    1. Month 1 (tighter cluster)
    2. Month 2 (wider spread)
    3. Both have equal consistency
    4. Cannot tell from dot plots
  7. Two datasets have the same mean of 50. Dataset X has an IQR of 10. Dataset Y has an IQR of 25. What does this imply?

    1. Dataset X is more spread out
    2. Dataset Y is more spread out in the middle 50%
    3. Both are identical except for outliers
    4. Dataset Y has a smaller range
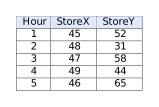
  8. Two grocery stores tracked the number of customers per hour over 5 hours: Which store had more predictable traffic?

    Comparing Populations with Measures of Center and Variability visual for G7-C08-T04-Q009
    1. Store X (mean 47, less variability)
    2. Store Y (more customers on average means more predictable)
    3. Both are equally predictable
    4. Cannot determine without knowing which store is busier
Teacher and parent reference

Answer key and explanations

  1. C. Store B typically sells more, but with less consistency

    Store B has a higher mean (\($480\) vs.\ \($450\)), indicating higher center. Its larger MAD (\($90\) vs.\ \($30\)) shows greater variability, meaning less consistency. A is false (Store A's mean is lower). B is false (MADs differ). D is false (lower MAD = more predictable, but Store B has higher MAD).

  2. A. The Sharks are more reliable free-throw shooters

    Although Tigers have a higher mean (75% vs.\ 72%), the Sharks have much lower MAD (4% vs.\ 8%), indicating more consistent free-throw shooting.

  3. A. Breed A (mean 47, smaller spread)

    Breed A ranges from 45--49 (range = 4), while Breed B ranges 35--55 (range = 20). Smaller range indicates greater consistency.

  4. D. Group 1 has outliers on the low end

    Group 1 has mean 82 but median 85. Since median is higher than mean, there are likely some very low scores pulling the mean down (low outliers).

  5. B. Period 2

    Period 2 has a range of 60 minutes, much larger than Period 1's range of 20 minutes, indicating more variability in homework times.

  6. A. Month 1 (tighter cluster)

    Month 1's dots cluster around 71--73\textdegree F (x-coordinates 1--3.5 map to 70--75\textdegree F), a narrow range of 2\textdegree F. Month 2's dots span from 71 to 82\textdegree F (x-coordinates 1--12, range \(\approx\) 11\textdegree F). Month 1 is more consistent.

  7. B. Dataset Y is more spread out in the middle 50%

    IQR (Interquartile Range) measures the middle 50% of data. Dataset Y's IQR of 25 is larger than Dataset X's IQR of 10, showing greater spread in the middle half.

  8. A. Store X (mean 47, less variability)

    Store X: 45, 46, 47, 48, 49 (mean = 47, range = 4, tightly clustered). Store Y: 31, 44, 52, 58, 65 (mean = 50, range = 34, highly variable). Predictability depends on consistency (low variability), not total customer count. Store X's tight clustering makes it far more predictable for planning staffing.

Free Testinar sample Reviewed November 6, 2026 testinar.com
Page UP