Testinar Grade 8 math

Fitting a Line to Data

Learn to reason about and solve Grade 8 problems involving Fitting a Line to Data.

CH06-02 Statistics, Data, and Probability
Name
Date
Score
____ / 8
Directions Solve each problem. Show your reasoning on the page or on separate paper. Check the answer key only after finishing.
  1. Which statement best explains why the trend line does NOT pass through every data point?
    Fitting a Line to Data visual for G8-C06-T02-Q003
    1. The data is not perfectly linear; there is natural variation
    2. The trend line is drawn incorrectly
    3. Some data points are too far from the line
    4. The axes are not labeled correctly
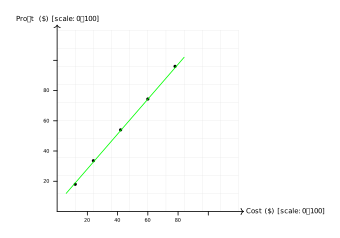
  2. Looking at the scatter plot above, approximately what is the profit when the cost is $60?

    Fitting a Line to Data visual for G8-C06-T02-Q005
    1. $80
    2. $60
    3. $40
    4. $20
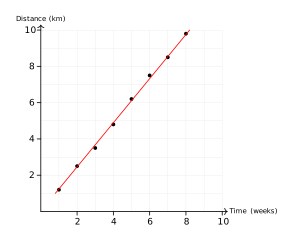
  3. A runner training program tracks distance over time. Based on the trend line, what is the approximate slope (distance per week)?

    Fitting a Line to Data visual for G8-C06-T02-Q008
    1. 1 km per week
    2. 1.2 km per week
    3. 2 km per week
    4. 0.5 km per week
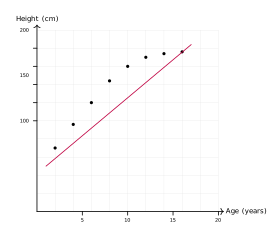
  4. Which statement best describes the trend shown in the scatter plot?

    Fitting a Line to Data visual for G8-C06-T02-Q010
    1. There is no relationship between age and height
    2. Age determines height perfectly
    3. Height decreases as age increases
    4. Height increases rapidly with age up to about age 16, then levels off
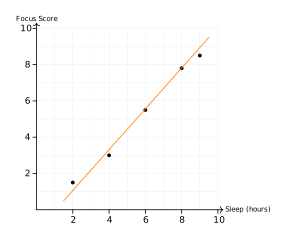
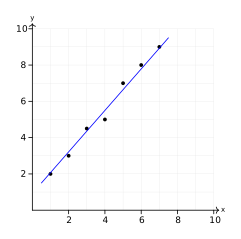
  5. Based on the trend line, if a student sleeps 7 hours, what is the predicted focus score?

    Fitting a Line to Data visual for G8-C06-T02-Q013
    1. Approximately 5
    2. Approximately 6
    3. Approximately 7
    4. Approximately 8
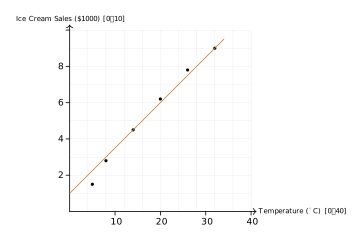
  6. The scatter plot shows temperature versus ice cream sales. What is the approximate \(y\)-intercept (sales when temperature is 0°C)?

    Fitting a Line to Data visual for G8-C06-T02-Q016
    1. $1000
    2. $0
    3. $2000
    4. $3000
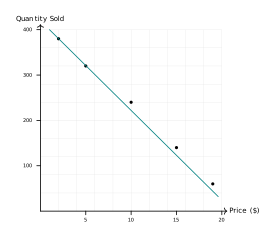
  7. A store analyzes the relationship between item price and quantity sold. Which interpretation is correct?

    Fitting a Line to Data visual for G8-C06-T02-Q018
    1. As price increases, quantity sold tends to decrease
    2. Higher prices cause fewer items to sell
    3. Price is not related to quantity sold
    4. Quantity sold determines the price
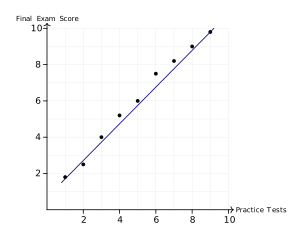
  8. A student takes 5 practice tests. Based on the trend line, what is the predicted final exam score?

    Fitting a Line to Data visual for G8-C06-T02-Q020
    1. Approximately 5
    2. Approximately 6
    3. Approximately 7
    4. Approximately 8
Teacher and parent reference

Answer key and explanations

  1. A. The data is not perfectly linear; there is natural variation

    Real-world data rarely fits a perfect line. A trend line balances passing close to all points, even if it doesn't pass through every one.

  2. A. $80

    At cost \($60\), the trend line is a little below the \($80\) mark and clearly above \($60\). The closest choice is about \($80\).

  3. B. 1.2 km per week

    Using two points on the trend line, slope \(= \frac{\Delta y}{\Delta x} = \frac{9-1}{8-0.67} \approx 1.2\) km/week.

  4. D. Height increases rapidly with age up to about age 16, then levels off

    The data shows steep growth early, flattening near age 15--16. This reflects human biology: rapid growth during childhood and early teens, then plateauing as growth ends in adulthood.

  5. C. Approximately 7

    Reading from the trend line at \(x=7\), the corresponding \(y\)-value is just under \(7\), so the best estimate is approximately \(7\).

  6. A. $1000

    Tracing the trend line back to \(x = 0\) (zero temperature), the line intersects the \(y\)-axis at approximately \(y = 1\) on the scale, which represents $1000 in sales.

  7. A. As price increases, quantity sold tends to decrease

    The negative trend indicates a negative association: higher prices correspond to lower sales on average.

  8. B. Approximately 6

    At \(x = 5\) on the trend line, the corresponding \(y\)-value is approximately 6.

Free Testinar sample Reviewed November 6, 2026 testinar.com
Page UP