Which table represents a LINEAR function?
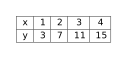
- Yes, the first differences are constant
- No, the \(y\)-values are not all even
- Yes, all \(y\)-values are positive
- No, the \(x\)-values increase


Learn to reason about and solve Grade 8 problems involving Linear vs. Nonlinear Functions.
Which table represents a LINEAR function?
Which table represents a NONLINEAR function?
Which graph represents a LINEAR function?
Which graph represents a NONLINEAR function?
Looking at the table below, is the function linear or nonlinear?
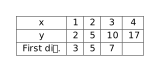
Which table shows a LINEAR function?
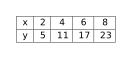
The table shows the distance traveled over time. Is this a linear relationship?
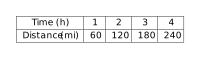
The table below shows costs. Identify whether the relationship is linear.
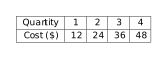
For a linear function, the differences between consecutive \(y\)-values are constant. Here: \(7-3=4\), \(11-7=4\), \(15-11=4\). A constant first difference indicates linearity.
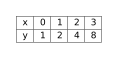
The differences between consecutive \(y\)-values are \(2-1=1\), \(4-2=2\), \(8-4=4\). These are not constant, which indicates the function is nonlinear.
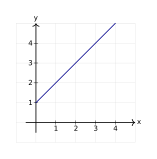
A linear function is represented by a straight line on a coordinate plane. This graph shows a straight line, so the function is linear.
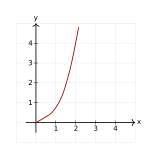
A nonlinear function does not form a straight line. This graph shows a parabola (curved shape), characteristic of a quadratic or nonlinear function.
The first differences are \(3, 5, 7\), which are not constant. When first differences vary, the function is nonlinear.
The \(y\)-values are \(5, 11, 17, 23\). The differences are \(11-5=6\), \(17-11=6\), and \(23-17=6\). Because the difference is constant for equal steps in \(x\), the function is linear.
The differences are \(120-60=60\), \(180-120=60\), \(240-180=60\). Constant differences mean this is a linear relationship with a speed of 60 mi/h.
The first differences are constant: \(24-12=12\), \(36-24=12\), \(48-36=12\). This represents a linear relationship where cost increases by $12 per item.
