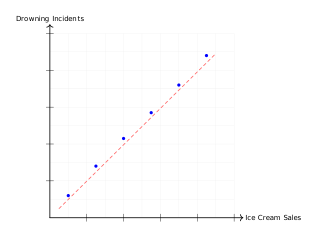
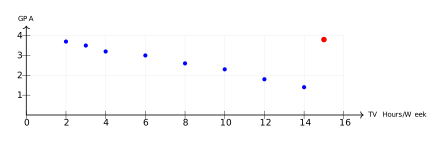
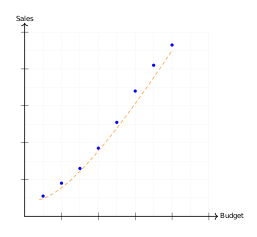
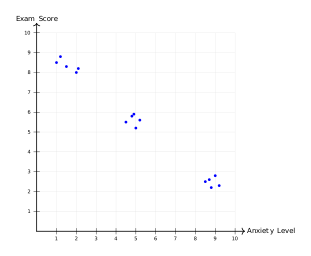
The scatter plot below shows age (in years) on the \(x\)-axis and income (in thousands of dollars) on the \(y\)-axis for 10 employees. Describe the correlation between age and income.
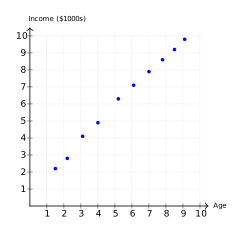
- Negative correlation
- No correlation
- Positive correlation
- Perfect correlation