Testinar Grade 8 math

Sketching and Describing Function Graphs

Learn to reason about and solve Grade 8 problems involving Sketching and Describing Function Graphs.

CH04-06 Functions and Linear Relationships
Name
Date
Score
____ / 8
Directions Solve each problem. Show your reasoning on the page or on separate paper. Check the answer key only after finishing.
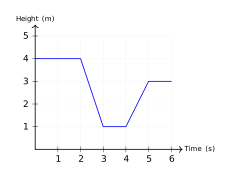
  1. A toy platform follows the height-time graph shown. Which description is accurate?
    Sketching and Describing Function Graphs visual for G8-C04-T06-Q002
    1. The object goes up constantly, then down, then flat
    2. The object stays level, drops, stays level, rises, stays level
    3. The object increases, then decreases throughout
    4. The object decreases in height initially
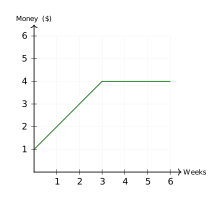
  2. A student saves money over time. The graph shows: increases for 3 weeks, then constant for 3 weeks. The \(y\)-intercept is 1. Which is true?

    Sketching and Describing Function Graphs visual for G8-C04-T06-Q003
    1. The student had $0 at the start
    2. The student had $1 initially and saves $1 per week, then stops
    3. The student spends money after week 3
    4. The function is linear over all 6 weeks
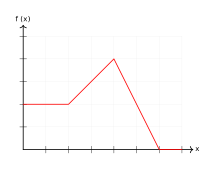
  3. Identify the intervals where the function is increasing.

    Sketching and Describing Function Graphs visual for G8-C04-T06-Q004
    1. From \(x=1\) to \(x=3\) only
    2. From \(x=-1\) to \(x=1\)
    3. From \(x=1\) to \(x=3\) and from \(x=3\) to \(x=5\)
    4. From \(x=-1\) to \(x=3\)
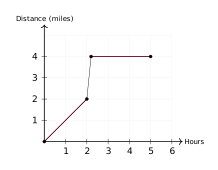
  4. A traveler's distance graph shows: 0 to 2 hours rising, then a jump, then flat. What does the jump represent?

    Sketching and Describing Function Graphs visual for G8-C04-T06-Q005
    1. The traveler rested without moving
    2. The traveler waited at the same distance
    3. This graph cannot represent a real physical scenario (discontinuity)
    4. The traveler went backward in distance
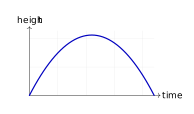
  5. Which graph matches: "A ball is thrown upward and falls back down"?

    Sketching and Describing Function Graphs visual for G8-C04-T06-Q006
    1. A line going up and to the right
    2. A curve (parabola) that rises then falls
    3. A flat horizontal line
    4. A line going down and to the right
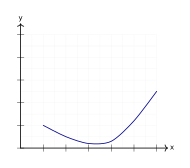
  6. Over which interval is the function decreasing?

    Sketching and Describing Function Graphs visual for G8-C04-T06-Q007
    1. From \(x=0\) to \(x=2\)
    2. From \(x=2\) to \(x=4\)
    3. From \(x=4\) to \(x=5\)
    4. Over the entire domain
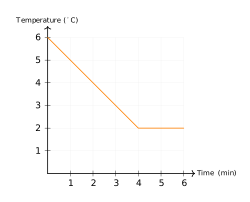
  7. A cup of hot liquid is placed in a freezer. Which statement about the graph is false?

    Sketching and Describing Function Graphs visual for G8-C04-T06-Q008
    1. Temperature increases from 0 to 2 minutes
    2. Temperature decreases from 2 to 4 minutes
    3. The function is linear from 4 to 6 minutes
    4. The initial temperature is 6 degrees C
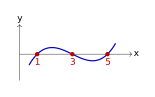
  8. A function has zeros at \(x=1\), \(x=3\), and \(x=5\). What does a zero represent on the graph?

    Sketching and Describing Function Graphs visual for G8-C04-T06-Q009
    1. Where the graph crosses the \(y\)-axis
    2. Where the graph reaches its maximum
    3. Where the function is undefined
    4. Where the function value is zero (the \(x\)-intercept)
Teacher and parent reference

Answer key and explanations

  1. B. The object stays level, drops, stays level, rises, stays level

    From 0 to 2s: flat (height constant at 4m). From 2 to 3s: the height drops to 1m. From 3 to 4s: flat at 1m. From 4 to 5s: the height rises to 3m. From 5 to 6s: flat at 3m.

  2. B. The student had $1 initially and saves $1 per week, then stops

    The \(y\)-intercept (at \(x=0\)) is 1, so the student has $1 initially. From 0 to 3 weeks, the graph rises linearly from 1 to 4, a gain of $1 per week. From week 3 to 6, the graph is flat at 4, so no additional savings.

  3. A. From \(x=1\) to \(x=3\) only

    From \(x=-1\) to \(x=1\): the function is constant at \(f(x)=2\) (neither increasing nor decreasing). From \(x=1\) to \(x=3\): the function increases from 2 to 4. From \(x=3\) onward: the function decreases.

  4. C. This graph cannot represent a real physical scenario (discontinuity)

    A jump discontinuity in a distance-time graph would mean the distance changes suddenly without showing the travel in between, which is not physically realistic for normal motion. A real distance-time graph should change continuously.

  5. B. A curve (parabola) that rises then falls

    The height increases initially (upward throw) then decreases (falling back). A parabola captures this curved motion better than a straight line. Option A is a line, C is constant, and D is always decreasing.

  6. A. From \(x=0\) to \(x=2\)

    The \(y\)-values decrease from 1 at \(x=0\) to approximately 0.2 at \(x=2\). After \(x=2\), the curve increases.

  7. A. Temperature increases from 0 to 2 minutes

    From 0 to 2 minutes, the graph shows the temperature decreasing from 6°C to 4°C. Option A claims an increase, so it is false.

  8. D. Where the function value is zero (the \(x\)-intercept)

    A zero of a function is a point where \(f(x) = 0\), represented on a graph as an \(x\)-intercept (where the curve crosses the \(x\)-axis). Option A is a \(y\)-intercept, B is a maximum, C is undefined.

Free Testinar sample Reviewed November 6, 2026 testinar.com
Page UP