Testinar Grade 8 math

Two-Way Tables for Categorical Data

Learn to reason about and solve Grade 8 problems involving Two-Way Tables for Categorical Data.

CH06-04 Statistics, Data, and Probability
Name
Date
Score
____ / 8
Directions Solve each problem. Show your reasoning on the page or on separate paper. Check the answer key only after finishing.
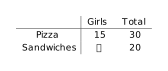
  1. A two-way table shows that \(30\) students like pizza and \(20\) like sandwiches. \(15\) of those who like pizza are girls. What is the relative frequency of girls among pizza-likers?
    Two-Way Tables for Categorical Data visual for G8-C06-T04-Q001
    1. \(50\%\)
    2. \(60\%\)
    3. \(30\%\)
    4. \(75\%\)
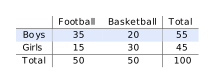
  2. The table below shows preferences for sports among 100 students. How many boys prefer basketball?

    Two-Way Tables for Categorical Data visual for G8-C06-T04-Q002
    1. 15
    2. 20
    3. 35
    4. 50
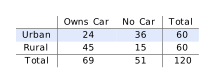
  3. A two-way table of \(120\) people shows: What is the joint frequency of rural people who own a car?

    Two-Way Tables for Categorical Data visual for G8-C06-T04-Q004
    1. \(\frac{60}{120}\)
    2. \(\frac{45}{60}\)
    3. \(\frac{45}{120}\)
    4. \(\frac{45}{69}\)
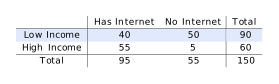
  4. A two-way table categorizes 150 households by income level and internet access: Among high-income households, what is the relative frequency of those without internet, as a decimal?

    Two-Way Tables for Categorical Data visual for G8-C06-T04-Q006
    1. \(0.033\)
    2. \(0.083\)
    3. \(0.367\)
    4. \(0.917\)
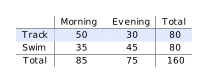
  5. A two-way table shows 160 athletes: What percentage of all athletes train in the morning on the track team?

    Two-Way Tables for Categorical Data visual for G8-C06-T04-Q010
    1. \(31.25\%\)
    2. \(37.5\%\)
    3. \(58.8\%\)
    4. \(62.5\%\)
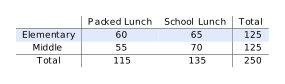
  6. A school newsletter reports that 250 students were surveyed about lunch preferences. The two-way table shows: What is the marginal frequency for middle school students?

    Two-Way Tables for Categorical Data visual for G8-C06-T04-Q012
    1. 55
    2. 70
    3. 115
    4. 125
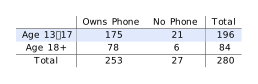
  7. A two-way table with 280 people: Among those who own a phone, what is the relative frequency for ages 13--17, rounded to the nearest hundredth?

    Two-Way Tables for Categorical Data visual for G8-C06-T04-Q014
    1. \(0.62\)
    2. \(0.69\)
    3. \(0.78\)
    4. \(0.89\)
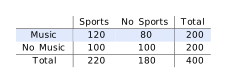
  8. A two-way table tracks 400 students by extracurricular activity: What is the marginal relative frequency for students who do sports, as a decimal?

    Two-Way Tables for Categorical Data visual for G8-C06-T04-Q016
    1. \(0.27\)
    2. \(0.45\)
    3. \(0.55\)
    4. \(0.73\)
Teacher and parent reference

Answer key and explanations

  1. A. \(50\%\)

    This is a row-conditional relative frequency. Among pizza-likers (30 total), 15 are girls: \(\frac{15}{30}=0.5=50\%\).

  2. B. 20

    This is a joint frequency (read directly from the cell). Row label Boys, column Basketball: entry is 20.

  3. C. \(\frac{45}{120}\)

    Joint frequency: intersection cell (45) divided by grand total (120). This answers 'what fraction of all respondents are rural car-owners?' = \(\frac{45}{120}\approx0.375\).

  4. B. \(0.083\)

    Among high-income households (total 60), those without internet = 5. Relative frequency = \(\frac{5}{60}\approx0.083\).

  5. A. \(31.25\%\)

    Joint frequency of morning track athletes: \(\frac{50}{160}=0.3125=31.25\%\).

  6. D. 125

    The marginal frequency for middle school is the row total: \(55+70=125\).

  7. B. \(0.69\)

    This is a column-conditional frequency. Among phone owners (253 total), ages 13--17 number 175. Relative frequency: \(\frac{175}{253}\approx0.69\).

  8. C. \(0.55\)

    Marginal relative frequency for sports: \(\frac{220}{400}=0.55\). This is the column-total ratio.

Free Testinar sample Reviewed November 6, 2026 testinar.com
Page UP