Testinar Grade 8 math

Using a Linear Model

Learn to reason about and solve Grade 8 problems involving Using a Linear Model.

CH06-03 Statistics, Data, and Probability
Name
Date
Score
____ / 8
Directions Solve each problem. Show your reasoning on the page or on separate paper. Check the answer key only after finishing.
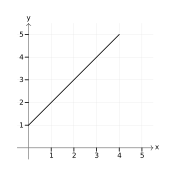
  1. What is the slope of the line shown in the graph?
    Using a Linear Model visual for G8-C06-T03-Q004
    1. \(\frac{1}{2}\)
    2. \(2\)
    3. \(1\)
    4. \(4.5\)
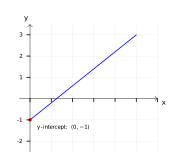
  2. The best-fit line for a dataset is \(y = 0.8x - 1\). Which statement best describes what the intercept represents?
    Using a Linear Model visual for G8-C06-T03-Q005
    1. For every 1-unit increase in \(x\), \(y\) increases by 0.8
    2. The predicted value of \(y\) when \(x=0\)
    3. The \(x\)-value when \(y=0\)
    4. The maximum value of \(y\)
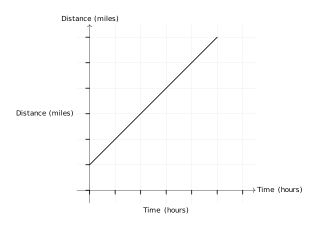
  3. A distance-time line is shown. What is the \(y\)-intercept?
    Using a Linear Model visual for G8-C06-T03-Q008
    1. \(0\)
    2. \(1\)
    3. \(5\)
    4. \(6\)
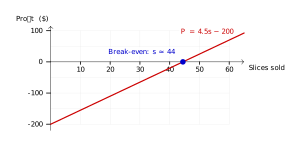
  4. A pizza shop's profit model is \(P = 4.5s - 200\), where \(P\) is profit in dollars and \(s\) is the number of slices sold. How many slices must be sold to break even (profit = 0)?
    Using a Linear Model visual for G8-C06-T03-Q009
    1. Approximately 35 slices
    2. Approximately 50 slices
    3. Approximately 100 slices
    4. Approximately 44 slices
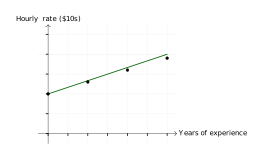
  5. A fitness trainer's hourly rate increases with years of experience: \(R = 20 + 3x\), where \(R\) is hourly rate in dollars and \(x\) is years of experience. What is the rate for someone with 6 years of experience?
    Using a Linear Model visual for G8-C06-T03-Q010
    1. \($32\)
    2. \($50\)
    3. \($38\)
    4. \($60\)
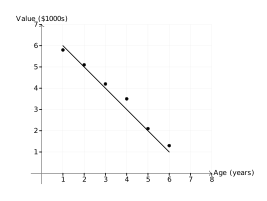
  6. A scatter plot shows vehicle age vs. value. Which best describes the relationship?
    Using a Linear Model visual for G8-C06-T03-Q012
    1. Positive linear relationship
    2. Negative linear relationship
    3. No relationship
    4. Exponential growth
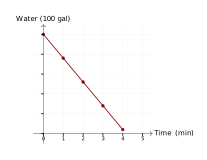
  7. A water tank drains following the model \(w = 500 - 120t\), where \(w\) is water remaining in gallons and \(t\) is time in minutes. What is the practical meaning of the \(-120\) coefficient?
    Using a Linear Model visual for G8-C06-T03-Q014
    1. 120 gallons of water remain at time 0
    2. 120 gallons drain per minute
    3. The tank holds 500 gallons total
    4. The tank is empty after 12 minutes
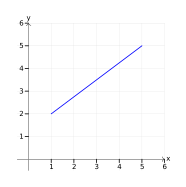
  8. What is the equation of the line in the graph?
    Using a Linear Model visual for G8-C06-T03-Q016
    1. \(y = \frac{3}{4}x + \frac{5}{4}\)
    2. \(y = \frac{1}{2}x + 1\)
    3. \(y = \frac{3}{4}x + 1\)
    4. \(y = x + 1\)
Teacher and parent reference

Answer key and explanations

  1. C. \(1\)

    The line passes through \((0,1)\) and \((4,5)\). Slope \(= \frac{5-1}{4-0} = \frac{4}{4} = 1\).

  2. B. The predicted value of \(y\) when \(x=0\)

    The \(y\)-intercept (here, \(-1\)) is the predicted value when \(x=0\). On the graph, it is where the line crosses the \(y\)-axis.

  3. B. \(1\)

    The line crosses the \(y\)-axis at \((0,1)\), so the \(y\)-intercept is 1.

  4. D. Approximately 44 slices

    Set \(P=0\): \(0=4.5s-200 \Rightarrow 4.5s=200 \Rightarrow s \approx 44.4\) slices.

  5. C. \($38\)

    Substitute \(x=6\): \(R=20+3(6)=20+18=$38\).

  6. B. Negative linear relationship

    As age increases, value decreases in a roughly linear pattern, indicating a negative relationship.

  7. B. 120 gallons drain per minute

    The coefficient \(-120\) is the slope, representing the rate of change: 120 gallons are lost each minute.

  8. A. \(y = \frac{3}{4}x + \frac{5}{4}\)

    Slope: \(\frac{5-2}{5-1}=\frac{3}{4}\). Using point \((1,2)\): \(2 = \frac{3}{4}(1) + b \Rightarrow b = \frac{5}{4}\).

Free Testinar sample Reviewed November 6, 2026 testinar.com
Page UP

