
Grades 8-12Free, no account needed
Standard deviation & variance calculator
Explore population or sample spread using exact squared deviations, variance and standard deviation, with an observation plot and an independent arithmetic check.
Try your problem
Supported inputs and limits
Use 1-20 comma-separated observations for population mode or 2-20 for sample mode; list at most 520 characters. Each scalar: signed integer, decimal with 1-6 decimal places, or integer fraction with positive denominator; at most 24 characters, numerator/denominator parts at most 12 digits, reduced denominator at most 1000000, magnitude at most 1000000. No expressions, mixed numbers, repeating decimals or exponents. Rational results and square-root forms are exact; irrational root approximations use 10 significant digits. Paste commands are case-sensitive, at most 200 characters: sd(population;1,2,3) or sd(sample;1,2,3). Plot coordinates are approximate.
Step by step
Understand the method
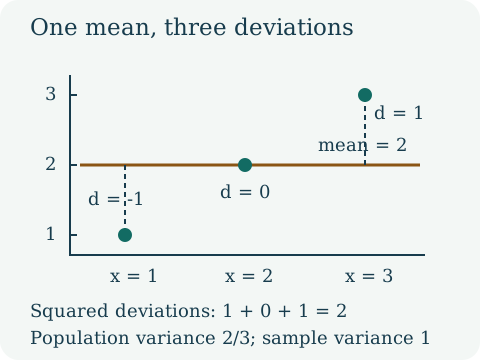
Start with the mean, then subtract it from every observation. Signed deviations sum to zero, so spread uses their squares rather than their signed sum.
Population variance divides the squared-deviation sum by n. Sample variance uses n - 1 when estimating population variance from a sample; at least two observations are needed. Take the square root for standard deviation in the original data units.
A shift of every observation leaves spread unchanged. Multiplying every observation by c multiplies variance by c squared and standard deviation by the absolute value of c. The live plot links each observation to the same mean line.
Worked examples
Read the reasoning, or load an example into the calculator.
Complete population
The eight values sum to 40, so mean = 5. Squared deviations sum to 32. Population variance = 32/8 = 4 and SD = 2.
Estimate from a sample
For 1,2,3 the mean is 2 and squared deviations total 2. Sample variance = 2/(3 - 1) = 1 and SD = 1.
Exact fractional spread
The mean of 1/3 and 2/3 is 1/2. Both squared deviations are 1/36; population variance is 1/36 and SD is exactly 1/6.
Try it without the calculator
Three questions for practice, not a graded school assessment. Your answers stay on this page and are not saved.
Original Testinar learning content. This local preview is awaiting final review before publication.