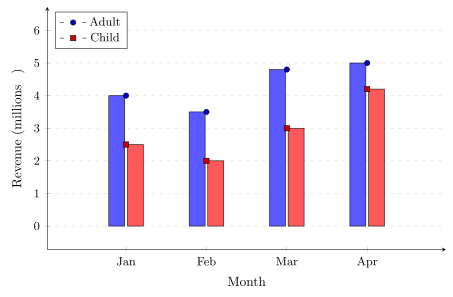
The bar graph shows the box-office revenue (in millions of dollars) for adult and child movie tickets at a local theater each month. Compare the decimal revenues. In which month was the difference between adult and child revenue the greatest? \begin{minipage}{0.5\textwidth} \centering \begin{tikzpicture} \begin{axis}[ width=\linewidth, height=8cm, ymajorgrids=true, grid style={gray!30, dashed}, axis lines=left, xmin=0.5, xmax=4.5, ymin=0, ymax=6, enlargelimits=0.12, xlabel={Month}, ylabel={Revenue (millions $)}, xtick={1,2,3,4}, xticklabels={Jan,Feb,Mar,Apr}, ytick={0,1,2,3,4,5,6}, tick label style={font=\small}, legend style={ at={(0.02,0.98)}, anchor=north west, font=\small, draw=black }, bar width=12pt, ] \addplot+[ybar, bar shift=-7pt, fill=blue!65, draw=black] coordinates { (1,4.0) (2,3.5) (3,4.8) (4,5.0) }; \addplot+[ybar, bar shift=7pt, fill=red!65, draw=black] coordinates { (1,2.5) (2,2.0) (3,3.0) (4,4.2) }; \legend{Adult, Child} \end{axis} \end{tikzpicture} \end{minipage}