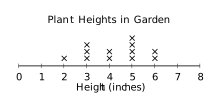
The line plot shows the heights of plants in Mrs.\ Garcia's garden: What is the most common plant height?
- 3 inches
- 4 inches
- 5 inches
- 6 inches


Students will reason about simple probability using data, outcomes, and everyday contexts.
The line plot shows the heights of plants in Mrs.\ Garcia's garden: What is the most common plant height?
A student is making a line plot for these pencil lengths, in inches: \[ 4\frac{1}{4},\;4\frac{1}{2},\;4\frac{1}{2},\;4\frac{3}{4},\;4\frac{3}{4},\;4\frac{3}{4},\;5,\;5 \] How many X's should be placed above \(4\frac{1}{2}\) inches?
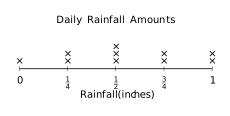
The line plot displays rainfall amounts (in inches) recorded over 10 days: What is the total rainfall recorded over the 10 days?
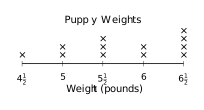
The line plot shows the weights (in pounds) of 12 puppies at a shelter: How many puppies weigh \(5\frac{1}{2}\) pounds?
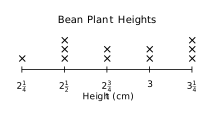
The line plot shows bean plant growth (in centimeters) for 11 students' projects: Which height is the least common?
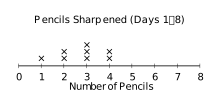
The line plot shows the number of pencils students sharpened on 8 days: How many data points are shown on the line plot?
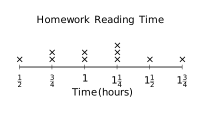
The line plot displays reading time (in hours) spent on homework by 10 students: What is the most common reading time?
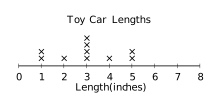
The line plot displays the lengths of toy cars (in inches) collected by a child: How many cars are less than 3 inches long?
Count the X marks at each height on the line plot. The height with the greatest number of X marks is 5 inches, which has 4 plants. Therefore, the most common plant height is 5 inches.
The measurement \(4\frac{1}{2}\) appears two times in the list, so the line plot should have 2 X's above \(4\frac{1}{2}\).
Add the rainfall amounts shown: \(0 + 2(\frac{1}{4}) + 3(\frac{1}{2}) + 2(\frac{3}{4}) + 2(1) = 0 + \frac{1}{2} + 1\frac{1}{2} + 1\frac{1}{2} + 2 = 5\frac{1}{2}\) inches.
Count the X marks above \(5\frac{1}{2}\). There are 3 X marks, so 3 puppies weigh exactly \(5\frac{1}{2}\) pounds.
Count the X marks above each height. The height \(2\frac{1}{4}\) cm has only 1 mark, so it is the least common.
Count all the X marks on the line plot. There are 1 + 2 + 3 + 2 = 8 X marks total, meaning 8 data points.
Count the X marks above each value. The value \(1\frac{1}{4}\) has 3 marks, which is more than any other value.
Count X marks above 1 and 2 inches only. There are 2 marks at 1 inch and 1 mark at 2 inches, totaling 3 cars less than 3 inches.
