CH08-06 lesson

Introduction to Probability Learning Activity

A focused Grade 5 learning session for Introduction to Probability using visual models, worked examples, strategy guidance, and a short mastery check.

15
minutes
6
lesson parts
11
practice items
Learning goal

Students will reason about simple probability using data, outcomes, and everyday contexts.

Student goal: I can describe simple probability situations.

Helpful first: Stem-and-Leaf Plots
concept

Learn the Idea

Introduction to Probability is the Grade 5 skill of describe the probability of events as likely, unlikely, certain, impossible, or equally likely. Make simple predictions about outcomes and begin to express probability as a fraction between 0 and 1.

What do the numbers represent, and what strategy shows the idea clearly?

Strong understanding comes from naming what the numbers, shapes, units, or data values represent, then showing the idea with a model or clear steps before solving.

The key to this topic is understanding the structure behind the work, not just following a rule. Students should be able to talk through what is happening, point to a model, and explain why the answer makes sense.

  • Identify what each number, unit, or symbol means before solving.
  • Choose a model or strategy that makes the relationship visible.
  • Explain why the answer fits the situation instead of stopping at computation.
  • Use the topic language from class discussions: Describe the probability of events as likely, unlikely, certain, impossible, or equally likely. Make simple predictions about outcomes and begin to express probability as a fraction between 0 and 1.
visual model

See the Math

Visual Model 1

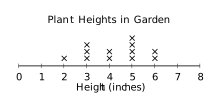
Question: The line plot shows the heights of plants in Mrs.\ Garcia's garden: What is the most common plant height?

Grade 5 Introduction to Probability figure 1

  • A. 3 inches
  • B. 4 inches
  • C. 5 inches
  • D. 6 inches

How the model helps: Count the X marks at each height on the line plot. The height with the greatest number of X marks is 5 inches, which has 4 plants. Therefore, the most common plant height is 5 inches.

worked example

Follow a Worked Example

Example 1

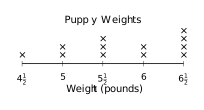
Question: The line plot shows the weights (in pounds) of 12 puppies at a shelter: How many puppies weigh \(5\frac{1}{2}\) pounds?

Grade 5 Introduction to Probability figure 3

  • A. 2
  • B. 3
  • C. 4
  • D. 5
  1. Count the X marks above \(5\frac{1}{2}\).
  2. There are 3 X marks, so 3 puppies weigh exactly \(5\frac{1}{2}\) pounds.

Answer: 3

Example 2

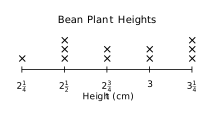
Question: The line plot shows bean plant growth (in centimeters) for 11 students' projects: Which height is the least common?

Grade 5 Introduction to Probability figure 4

  • A. \(2\frac{1}{4}\) cm
  • B. \(2\frac{1}{2}\) cm
  • C. \(2\frac{3}{4}\) cm
  • D. \(3\) cm
  1. Count the X marks above each height.
  2. The height \(2\frac{1}{4}\) cm has only 1 mark, so it is the least common.

Answer: \(2\frac{1}{4}\) cm

real world

Connect It to a Real Situation

Problem 1

Question: A student is making a line plot for these pencil lengths, in inches: \[ 4\frac{1}{4}, 4\frac{1}{2}, 4\frac{1}{2}, 4\frac{3}{4}, 4\frac{3}{4}, 4\frac{3}{4}, 5, 5 \] How many X's should be placed above \(4\frac{1}{2}\) inches?

  • A. 1
  • B. 4
  • C. 3
  • D. 2

Answer: 2

Why it works: The measurement \(4\frac{1}{2}\) appears two times in the list, so the line plot should have 2 X's above \(4\frac{1}{2}\).

strategy

Avoid Mistakes and Choose a Strategy

  • Starting the computation before identifying what the numbers, units, or parts represent.
  • Skipping the model or visual and relying only on a memorized rule.
  • Forgetting to estimate, which makes it easier to miss an unreasonable answer.
  • Stopping at a number without explaining what the answer means in context.
  • Read the situation slowly and name what each number or label represents.
  • Use a model, table, chart, number line, or sketch before finishing the computation.
  • Estimate first so you already know the answer's approximate size.
  • Check the answer with an inverse operation, another representation, or a sentence explanation.
  • Say the math idea out loud in simple words before writing the final answer.
summary

Remember the Key Idea

Introduction to Probability gets easier when students read the model, track what each number means, and explain why the answer fits the situation.

GOLDEN RULE

Understand the structure first, then solve, check, and explain why the answer makes sense.

Guided to independent practice

Solve before opening the answer

Use scratch paper. The explanation matters more than simply seeing whether the choice is correct.

warmup

2 questions
G5-C06-T04-Q001 About 1 min

The line plot shows the heights of plants in Mrs.\ Garcia's garden: What is the most common plant height?

Making Line Plots with Fraction Measurements visual for G5-C06-T04-Q001
  1. A 3 inches
  2. B 4 inches
  3. C 5 inches
  4. D 6 inches
Check answer and explanation

Answer C: 5 inches

Count the X marks at each height on the line plot. The height with the greatest number of X marks is 5 inches, which has 4 plants. Therefore, the most common plant height is 5 inches.
G5-C06-T04-Q002 About 1 min

A student is making a line plot for these pencil lengths, in inches: \[ 4\frac{1}{4},\;4\frac{1}{2},\;4\frac{1}{2},\;4\frac{3}{4},\;4\frac{3}{4},\;4\frac{3}{4},\;5,\;5 \] How many X's should be placed above \(4\frac{1}{2}\) inches?

  1. A 1
  2. B 4
  3. C 3
  4. D 2
Check answer and explanation

Answer D: 2

The measurement \(4\frac{1}{2}\) appears two times in the list, so the line plot should have 2 X's above \(4\frac{1}{2}\).

guided

1 question
G5-C06-T04-Q003 About 1 min

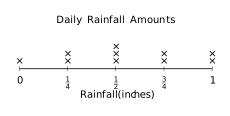
The line plot displays rainfall amounts (in inches) recorded over 10 days: What is the total rainfall recorded over the 10 days?

Making Line Plots with Fraction Measurements visual for G5-C06-T04-Q003
  1. A \(4\frac{1}{2}\) inches
  2. B \(5\) inches
  3. C \(5\frac{1}{2}\) inches
  4. D \(6\) inches
Check answer and explanation

Answer C: \(5\frac{1}{2}\) inches

Add the rainfall amounts shown: \(0 + 2(\frac{1}{4}) + 3(\frac{1}{2}) + 2(\frac{3}{4}) + 2(1) = 0 + \frac{1}{2} + 1\frac{1}{2} + 1\frac{1}{2} + 2 = 5\frac{1}{2}\) inches.

practice

5 questions
G5-C06-T04-Q004 About 1 min

The line plot shows the weights (in pounds) of 12 puppies at a shelter: How many puppies weigh \(5\frac{1}{2}\) pounds?

Making Line Plots with Fraction Measurements visual for G5-C06-T04-Q004
  1. A 2
  2. B 3
  3. C 4
  4. D 5
Check answer and explanation

Answer B: 3

Count the X marks above \(5\frac{1}{2}\). There are 3 X marks, so 3 puppies weigh exactly \(5\frac{1}{2}\) pounds.

G5-C06-T04-Q005 About 1 min

The line plot shows bean plant growth (in centimeters) for 11 students' projects: Which height is the least common?

Making Line Plots with Fraction Measurements visual for G5-C06-T04-Q005
  1. A \(2\frac{1}{4}\) cm
  2. B \(2\frac{1}{2}\) cm
  3. C \(2\frac{3}{4}\) cm
  4. D \(3\) cm
Check answer and explanation

Answer A: \(2\frac{1}{4}\) cm

Count the X marks above each height. The height \(2\frac{1}{4}\) cm has only 1 mark, so it is the least common.

G5-C06-T04-Q006 About 1 min

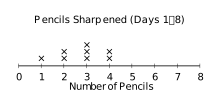
The line plot shows the number of pencils students sharpened on 8 days: How many data points are shown on the line plot?

Making Line Plots with Fraction Measurements visual for G5-C06-T04-Q006
  1. A 6
  2. B 7
  3. C 9
  4. D 8
Check answer and explanation

Answer D: 8

Count all the X marks on the line plot. There are 1 + 2 + 3 + 2 = 8 X marks total, meaning 8 data points.

G5-C06-T04-Q007 About 1 min

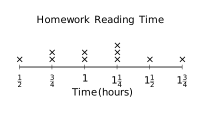
The line plot displays reading time (in hours) spent on homework by 10 students: What is the most common reading time?

Making Line Plots with Fraction Measurements visual for G5-C06-T04-Q007
  1. A \(\frac{3}{4}\) hour
  2. B \(1\) hour
  3. C \(1\frac{1}{4}\) hours
  4. D \(1\frac{1}{2}\) hours
Check answer and explanation

Answer C: \(1\frac{1}{4}\) hours

Count the X marks above each value. The value \(1\frac{1}{4}\) has 3 marks, which is more than any other value.

G5-C06-T04-Q008 About 1 min

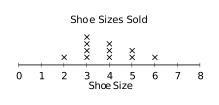
The line plot shows the number of shoes various sizes sold at a store: What is the most popular shoe size?

Making Line Plots with Fraction Measurements visual for G5-C06-T04-Q008
  1. A 2
  2. B 3
  3. C 4
  4. D 5
Check answer and explanation

Answer B: 3

Count the X marks above each shoe size. Size 3 has 4 X marks, which is more than any other size.

exit

3 questions
G5-C06-T04-Q009 About 1 min

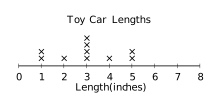
The line plot displays the lengths of toy cars (in inches) collected by a child: How many cars are less than 3 inches long?

Making Line Plots with Fraction Measurements visual for G5-C06-T04-Q009
  1. A 2
  2. B 3
  3. C 4
  4. D 5
Check answer and explanation

Answer B: 3

Count X marks above 1 and 2 inches only. There are 2 marks at 1 inch and 1 mark at 2 inches, totaling 3 cars less than 3 inches.

G5-C06-T04-Q010 About 1 min

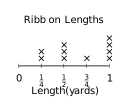
The line plot shows ribbon lengths (in yards) measured by 10 students: How many ribbons were longer than \(\frac{1}{2}\) yard?

Making Line Plots with Fraction Measurements visual for G5-C06-T04-Q010
  1. A 3
  2. B 4
  3. C 5
  4. D 6
Check answer and explanation

Answer C: 5

Lengths longer than \(\frac{1}{2}\) yard are \(\frac{3}{4}\) and \(1\) yard. The plot shows \(1+4=5\) such ribbons.

G5-C06-T04-Q011 About 1 min

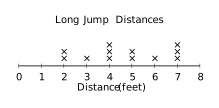
The line plot displays distances (in feet) that students jumped in gym class: What is the range of jump distances?

Making Line Plots with Fraction Measurements visual for G5-C06-T04-Q011
  1. A 3 feet
  2. B 4 feet
  3. C 5 feet
  4. D 6 feet
Check answer and explanation

Answer C: 5 feet

The greatest distance is 7 feet and the least is 2 feet. Range = \(7 - 2 = 5\) feet.

Page UP