A box plot shows the following five-number summary: minimum \(= 10\), Q\(_1=14\), median \(= 18\), Q\(_3=22\), maximum \(= 30\). What is the interquartile range (IQR)?
- \(4\)
- \(8\)
- \(12\)
- \(20\)


Students will build Grade 6 mastery of box plots using models, equations, and test-style reasoning.
A box plot shows the following five-number summary: minimum \(= 10\), Q\(_1=14\), median \(= 18\), Q\(_3=22\), maximum \(= 30\). What is the interquartile range (IQR)?
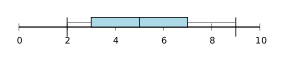
Use the box plot below to find the median:
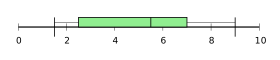
Which value represents Q\(_1\) in the box plot shown?
A dataset has Q\(_1=8\) and Q\(_3=20\). What is the range of the middle 50% of the data?
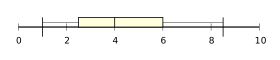
Use the box plot below. What is the maximum value?
Compare two box plots: Dataset A has median 50 and IQR 15; Dataset B has median 45 and IQR 20. Which statement is true?
A dataset has the five-number summary: min \(= 6\), Q\(_1=10\), median \(= 13\), Q\(_3=18\), max \(= 25\). Which represents the IQR?
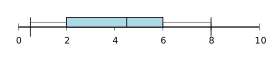
Use the box plot below to find the range of the entire dataset:
IQR \(=\) Q\(_3-\)Q\(_1=22-14=8\).
The median is shown by the line inside the box of the box plot.
Q\(_1\) is the left edge of the box in the box plot.
The middle 50% is the IQR: Q\(_3-\)Q\(_1=20-8=12\).
The maximum is shown by the right whisker endpoint of the box plot.
Median measures center; IQR measures spread. Dataset A's median is higher and IQR is smaller (less spread).
IQR \(=\) Q\(_3-\)Q\(_1=18-10=8\).
Range \(=\) max \(-\) min \(= 8 - 0.5 = 7.5\).
