Visual Model 1
Question: Use the box plot below to find the median:

- A. \(2\)
- B. \(3\)
- C. \(5\)
- D. \(7\)
Why it works: The median is shown by the line inside the box of the box plot.
Answer: \(5\)


A focused Grade 6 learning session for Box Plots using visual models, worked examples, strategy guidance, and a short mastery check.
Student goal: I can solve problems involving box plots.
Box Plots means reading, creating, and explaining displays so data can answer real questions.
Question: Use the box plot below to find the median:
Why it works: The median is shown by the line inside the box of the box plot.
Answer: \(5\)
Question: Use the box plot below. What is the maximum value?

Answer: \(8.5\)
Question: Use the box plot below to find the range of the entire dataset:

Answer: \(7.5\)
Question: The five-number summary of student test scores is: min \(= 55\), Q\(_1=70\), median \(= 78\), Q\(_3=85\), max \(= 98\). How many points is the range?
Why it works: Range \(=\) max \(-\) min \(= 98 - 55 = 43\) points.
Answer: \(43\)
Box Plots becomes easier when students connect the question to a model, use clear steps, and explain why the answer fits.
Read the scale before reading the answer.
Use scratch paper. The explanation matters more than simply seeing whether the choice is correct.
A box plot shows the following five-number summary: minimum \(= 10\), Q\(_1=14\), median \(= 18\), Q\(_3=22\), maximum \(= 30\). What is the interquartile range (IQR)?
Answer B: \(8\)
IQR \(=\) Q\(_3-\)Q\(_1=22-14=8\).
Use the box plot below to find the median:
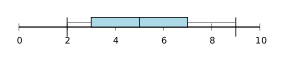
Answer C: \(5\)
The median is shown by the line inside the box of the box plot.
Which value represents Q\(_1\) in the box plot shown?
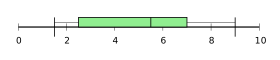
Answer B: \(2.5\)
Q\(_1\) is the left edge of the box in the box plot.
A dataset has Q\(_1=8\) and Q\(_3=20\). What is the range of the middle 50% of the data?
Answer D: \(12\)
The middle 50% is the IQR: Q\(_3-\)Q\(_1=20-8=12\).
Use the box plot below. What is the maximum value?
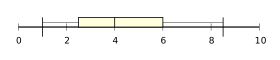
Answer D: \(8.5\)
The maximum is shown by the right whisker endpoint of the box plot.
Compare two box plots: Dataset A has median 50 and IQR 15; Dataset B has median 45 and IQR 20. Which statement is true?
Answer A: Dataset A has a higher center and less spread.
Median measures center; IQR measures spread. Dataset A's median is higher and IQR is smaller (less spread).
A dataset has the five-number summary: min \(= 6\), Q\(_1=10\), median \(= 13\), Q\(_3=18\), max \(= 25\). Which represents the IQR?
Answer B: \(8\)
IQR \(=\) Q\(_3-\)Q\(_1=18-10=8\).
Which part of a box plot represents the bottom 25% of the data?
Answer A: The lower whisker.
The lower whisker extends from the minimum to Q\(_1\), representing the bottom 25% of the data.
Use the box plot below to find the range of the entire dataset:
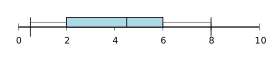
Answer D: \(7.5\)
Range \(=\) max \(-\) min \(= 8 - 0.5 = 7.5\).
The five-number summary for test scores is: min \(= 42\), Q\(_1=68\), median \(= 76\), Q\(_3=84\), max \(= 95\). How many points separate Q\(_1\) from Q\(_3\)?
Answer B: \(16\)
IQR \(=\) Q\(_3-\)Q\(_1=84-68=16\) points.
Which value represents the minimum in this box plot?
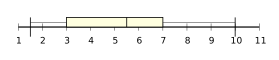
Answer A: \(1.5\)
The minimum is the left endpoint of the lower whisker.
