CH05-07 lesson

Summarizing Data and Making Comparisons Learning Activity

A focused Grade 6 learning session for Summarizing Data and Making Comparisons using visual models, worked examples, strategy guidance, and a short mastery check.

15
minutes
6
lesson parts
11
practice items
Learning goal

Students will build Grade 6 mastery of summarizing data and making comparisons using models, equations, and test-style reasoning.

Student goal: I can solve problems involving summarizing data and making comparisons.

Helpful first: Box Plots
concept

Learn the Idea

Summarizing Data and Making Comparisons means reading, creating, and explaining displays so data can answer real questions.

  • Read the title, labels, and scale before answering.
  • Use the scale value instead of counting marks as ones when the graph is scaled.
  • Compare categories by subtracting or adding values from the display.
  • Explain what the data shows in a complete sentence.
visual model

See the Math

Visual Model 1

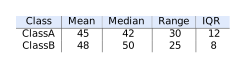
Question: Two classes recorded the time (in seconds) each student spent on a warm-up. Summary statistics: Which class had more consistent times?

ClassMeanMedianRangeIQR
Class A45423012
Class B4850258
  • A. Class A
  • B. Class B
  • C. Both had the same variability.
  • D. Cannot be determined.

Why it works: Class B has a smaller range (\(25 < 30\)) and smaller IQR (\(8 < 12\)), indicating less spread and more consistent times.

Answer: Class B
worked example

Follow a Worked Example

Example 1

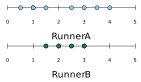
Question: Two runners' sprint times (seconds) over 8 races. Which runner has more consistent sprint times?

Example 1

  • A. Runner A
  • B. Runner B
  • C. Both are equally consistent
  • D. Cannot determine from dot plots
  1. Runner B's times cluster tightly around 2–3 seconds (range \(\approx 1.5\)), while Runner A's times are spread from 0.5 to 4 seconds (range \(\approx 3.5\)).
  2. Smaller range indicates more consistency.

Answer: Runner B

Example 2

Question: Two manufacturing plants' defect rates (per 1000 units) are summarized below. Which plant's performance is more predictable?

PlantMeanMedianRange
Plant X12118
Plant Y101020
  • A. Plant X, because it has a lower range
  • B. Plant Y, because it has a lower mean
  • C. Both are equally predictable
  • D. Plant X, because the mean equals the median
  1. Predictability is measured by spread/consistency.
  2. Plant X (range = 8) is more consistent than Plant Y (range = 20), making its output more predictable despite a slightly higher mean.

Answer: Plant X, because it has a lower range

real world

Connect It to a Real Situation

Problem 1

Question: A dot plot shows the number of books read by 10 students: \(2, 3, 3, 4, 4, 4, 5, 5, 6, 6\). What is the median number of books?

  • A. \(4\)
  • B. \(6\)
  • C. \(5\)
  • D. \(4.5\)

Why it works: With 10 data points, the median is the average of the 5th and 6th values when ordered: \((4+5) \div 2 = 4.5\).

Answer: \(4.5\)

strategy

Avoid Mistakes and Choose a Strategy

  • Ignoring the graph scale.
  • Reading the wrong category or axis label.
  • Answering a comparison question without subtracting.
  • Writing a number without explaining what it represents.
  • Circle the scale before using the graph.
  • Write down the value for each category you compare.
  • Use addition for totals and subtraction for differences.
  • Answer in words so the data result has meaning.
summary

Remember the Key Idea

Summarizing Data and Making Comparisons becomes easier when students connect the question to a model, use clear steps, and explain why the answer fits.

GOLDEN RULE

Read the scale before reading the answer.

Guided to independent practice

Solve before opening the answer

Use scratch paper. The explanation matters more than simply seeing whether the choice is correct.

warmup

2 questions
G6-C05-T07-Q001 About 1 min

Class A scored a mean of \(82\) on a test; Class B scored a mean of \(76\) on the same test. Which statement is best supported by the data?

  1. A Every student in Class A scored higher than every student in Class B.
  2. B Class A's typical score was higher than Class B's.
  3. C Class B had more students than Class A.
  4. D The two classes had identical performance.
Check answer and explanation

Answer B: Class A's typical score was higher than Class B's.

The mean represents a typical score. A higher mean in Class A (\(82>76\)) supports that Class A's typical score was higher, but not that every individual outperformed.

G6-C05-T07-Q002 About 1 min

A dot plot shows the number of books read by 10 students: \(2, 3, 3, 4, 4, 4, 5, 5, 6, 6\). What is the median number of books?

  1. A \(4\)
  2. B \(6\)
  3. C \(5\)
  4. D \(4.5\)
Check answer and explanation

Answer D: \(4.5\)

With 10 data points, the median is the average of the 5th and 6th values when ordered: \((4+5) \div 2 = 4.5\).

guided

1 question
G6-C05-T07-Q003 About 1 min

A dataset has a mean of \(50\) and a median of \(48\). Which statement is most likely true?

  1. A The data is symmetric with no outliers.
  2. B There are some large values pulling the mean higher than the median.
  3. C There are some small values pulling the mean lower than the median.
  4. D The range must be less than 10.
Check answer and explanation

Answer B: There are some large values pulling the mean higher than the median.

When the mean exceeds the median, high outliers are typically present, skewing the distribution right.

practice

5 questions
G6-C05-T07-Q004 About 1 min

A histogram shows test scores for a class. The data has a center (mean) of \(75\) and a spread (range) of \(30\). If the highest score is \(95\), what is the lowest score?

  1. A \(45\)
  2. B \(55\)
  3. C \(65\)
  4. D \(75\)
Check answer and explanation

Answer C: \(65\)

Range = highest \(-\) lowest. \(30 = 95 - \text{lowest}\), so lowest \(= 95 - 30 = 65\).

G6-C05-T07-Q005 About 1 min

Two classes recorded the time (in seconds) each student spent on a warm-up. Summary statistics: Which class had more consistent times?

Summarizing Data and Making Comparisons visual for G6-C05-T07-Q005
  1. A Class A
  2. B Class B
  3. C Both had the same variability.
  4. D Cannot be determined.
Check answer and explanation

Answer B: Class B

Class B has a smaller range (\(25 < 30\)) and smaller IQR (\(8 < 12\)), indicating less spread and more consistent times.

G6-C05-T07-Q006 About 1 min

A box plot for Dataset X shows Q1 = \(20\), median = \(25\), Q3 = \(35\). A box plot for Dataset Y shows Q1 = \(22\), median = \(26\), Q3 = \(32\). Which statement is true?

  1. A Dataset X has a larger interquartile range.
  2. B Dataset Y has a larger interquartile range.
  3. C Both have the same interquartile range.
  4. D The IQR cannot be compared.
Check answer and explanation

Answer A: Dataset X has a larger interquartile range.

IQR for X \(= 35 - 20 = 15\); IQR for Y \(= 32 - 22 = 10\). Dataset X is larger.

G6-C05-T07-Q007 About 1 min

A dot plot shows scores: \(\{3, 5, 7, 7, 8, 8, 8, 9\}\). What is the mode?

  1. A \(7\)
  2. B \(3\)
  3. C \(9\)
  4. D \(8\)
Check answer and explanation

Answer D: \(8\)

The mode is the value appearing most frequently. The value \(8\) appears 3 times, more than any other value.

G6-C05-T07-Q008 About 1 min

A dataset has 11 values arranged in order. The median is \(55\). If you remove the largest and smallest values, what will be the new median of the remaining 9 values?

  1. A The median stays at \(55\).
  2. B The median decreases to \(50\).
  3. C The median increases to \(60\).
  4. D Cannot be determined without knowing all values.
Check answer and explanation

Answer D: Cannot be determined without knowing all values.

The new median depends on the actual distribution. Removing extremes does not guarantee the new 5th value is still \(55\).

exit

3 questions
G6-C05-T07-Q009 About 1 min

A histogram shows weights of 20 students. The shape is roughly symmetric. Which summary best describes the center?

  1. A The mean, because symmetric data has mean \(\approx\) median.
  2. B The median, because it is resistant to outliers.
  3. C The mode, because it is the most common value.
  4. D The range, because it spans the entire data.
Check answer and explanation

Answer A: The mean, because symmetric data has mean \(\approx\) median.

For symmetric distributions, mean and median are nearly equal and both represent the center well.

G6-C05-T07-Q010 About 1 min

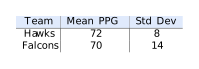
Two basketball teams' season statistics: Which team had more consistent scoring?

Summarizing Data and Making Comparisons visual for G6-C05-T07-Q010
  1. A Hawks (lower standard deviation)
  2. B Falcons (higher mean)
  3. C Both equally consistent
  4. D Cannot tell from standard deviation
Check answer and explanation

Answer A: Hawks (lower standard deviation)

Standard deviation measures spread. Hawks' lower standard deviation (\(8 < 14\)) indicates more consistent scoring around their mean.

G6-C05-T07-Q011 About 1 min

A dataset contains: \(10, 12, 14, 18, 20, 22\). What is the interquartile range (IQR)?

  1. A \(6\)
  2. B \(8\)
  3. C \(10\)
  4. D \(15\)
Check answer and explanation

Answer B: \(8\)

The data is already ordered. With 6 values, the lower half is \(\{10, 12, 14\}\) giving \(Q_1 = 12\), and the upper half is \(\{18, 20, 22\}\) giving \(Q_3 = 20\). So \(\text{IQR} = Q_3 - Q_1 = 20 - 12 = 8\).

Page UP