

Testinar Grade 6 math

Summarizing Data and Making Comparisons

Students will build Grade 6 mastery of summarizing data and making comparisons using models, equations, and test-style reasoning.

CH05-07 Statistics and Probability
Name
Date
Score
____ / 8
Directions Solve each problem. Show your reasoning on the page or on separate paper. Check the answer key only after finishing.
  1. Class A scored a mean of \(82\) on a test; Class B scored a mean of \(76\) on the same test. Which statement is best supported by the data?

    1. Every student in Class A scored higher than every student in Class B.
    2. Class A's typical score was higher than Class B's.
    3. Class B had more students than Class A.
    4. The two classes had identical performance.
  2. A dot plot shows the number of books read by 10 students: \(2, 3, 3, 4, 4, 4, 5, 5, 6, 6\). What is the median number of books?

    1. \(4\)
    2. \(6\)
    3. \(5\)
    4. \(4.5\)
  3. A dataset has a mean of \(50\) and a median of \(48\). Which statement is most likely true?

    1. The data is symmetric with no outliers.
    2. There are some large values pulling the mean higher than the median.
    3. There are some small values pulling the mean lower than the median.
    4. The range must be less than 10.
  4. A histogram shows test scores for a class. The data has a center (mean) of \(75\) and a spread (range) of \(30\). If the highest score is \(95\), what is the lowest score?

    1. \(45\)
    2. \(55\)
    3. \(65\)
    4. \(75\)
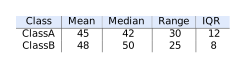
  5. Two classes recorded the time (in seconds) each student spent on a warm-up. Summary statistics: Which class had more consistent times?

    Summarizing Data and Making Comparisons visual for G6-C05-T07-Q005
    1. Class A
    2. Class B
    3. Both had the same variability.
    4. Cannot be determined.
  6. A box plot for Dataset X shows Q1 = \(20\), median = \(25\), Q3 = \(35\). A box plot for Dataset Y shows Q1 = \(22\), median = \(26\), Q3 = \(32\). Which statement is true?

    1. Dataset X has a larger interquartile range.
    2. Dataset Y has a larger interquartile range.
    3. Both have the same interquartile range.
    4. The IQR cannot be compared.
  7. A dot plot shows scores: \(\{3, 5, 7, 7, 8, 8, 8, 9\}\). What is the mode?

    1. \(7\)
    2. \(3\)
    3. \(9\)
    4. \(8\)
  8. A histogram shows weights of 20 students. The shape is roughly symmetric. Which summary best describes the center?

    1. The mean, because symmetric data has mean \(\approx\) median.
    2. The median, because it is resistant to outliers.
    3. The mode, because it is the most common value.
    4. The range, because it spans the entire data.
Teacher and parent reference

Answer key and explanations

  1. B. Class A's typical score was higher than Class B's.

    The mean represents a typical score. A higher mean in Class A (\(82>76\)) supports that Class A's typical score was higher, but not that every individual outperformed.

  2. D. \(4.5\)

    With 10 data points, the median is the average of the 5th and 6th values when ordered: \((4+5) \div 2 = 4.5\).

  3. B. There are some large values pulling the mean higher than the median.

    When the mean exceeds the median, high outliers are typically present, skewing the distribution right.

  4. C. \(65\)

    Range = highest \(-\) lowest. \(30 = 95 - \text{lowest}\), so lowest \(= 95 - 30 = 65\).

  5. B. Class B

    Class B has a smaller range (\(25 < 30\)) and smaller IQR (\(8 < 12\)), indicating less spread and more consistent times.

  6. A. Dataset X has a larger interquartile range.

    IQR for X \(= 35 - 20 = 15\); IQR for Y \(= 32 - 22 = 10\). Dataset X is larger.

  7. D. \(8\)

    The mode is the value appearing most frequently. The value \(8\) appears 3 times, more than any other value.

  8. A. The mean, because symmetric data has mean \(\approx\) median.

    For symmetric distributions, mean and median are nearly equal and both represent the center well.

Free Testinar sample Reviewed November 6, 2026 testinar.com
Page UP