A circle graph shows that \(40\%\) of \(250\) students prefer pizza for lunch. How many students prefer pizza?
- \(40\)
- \(75\)
- \(100\)
- \(150\)


Students will build Grade 6 mastery of circle graphs using models, equations, and test-style reasoning.
A circle graph shows that \(40\%\) of \(250\) students prefer pizza for lunch. How many students prefer pizza?
A circle graph shows the favorite ice cream flavors of 200 people. If \(30\%\) prefer vanilla, how many people prefer vanilla?
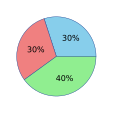
A restaurant surveyed 180 customers about their favorite drink. The circle graph shows \(25\%\) like coffee. How many customers prefer coffee?
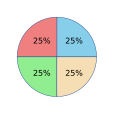
A circle graph shows the results of a survey with 300 students. One section is \(20\%\). How many students are in this section?
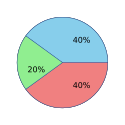
The circle graph shows equal portions of 120 total items. What is the measure of the central angle for each section?
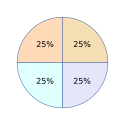
A circle graph shows transportation methods for 500 commuters. If \(45\%\) drive a car, how many commuters drive a car?
A survey of 360 people asked about favorite pizza toppings. One section of the circle graph represents \(\frac{1}{5}\) of the total. What central angle does this represent?
A music store polled 200 customers about preferred instruments. If the circle graph shows \(50\%\) prefer guitar, how many customers prefer guitar?
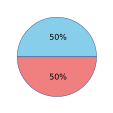
\(40\%\) of \(250\) is \(0.40\times250=100\) students.
\(30\%\) of \(200\) is \(0.30\times200=60\) people.
\(25\%\) of \(180\) is \(0.25\times180=45\) customers.
\(20\%\) of \(300\) is \(0.20\times300=60\) students.
Each section represents \(25\%\). The central angle is \(0.25\times360°=90°\).
\(45\%\) of \(500\) is \(0.45\times500=225\) commuters.
\(\frac{1}{5}\) equals \(20\%\). The central angle is \(0.20\times360°=72°\).
\(50\%\) of \(200\) is \(0.50\times200=100\) customers.
