Visual Model 1
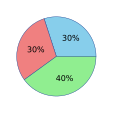
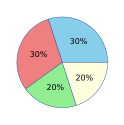
Question: A circle graph shows the favorite ice cream flavors of 200 people. If \(30\%\) prefer vanilla, how many people prefer vanilla?

- A. \(60\)
- B. \(50\)
- C. \(30\)
- D. \(80\)
Why it works: \(30\%\) of \(200\) is \(0.30\times200=60\) people.
Answer: \(60\)