CH05-11 lesson

Data Displays Extended Learning Activity

A focused Grade 6 learning session for Data Displays Extended using visual models, worked examples, strategy guidance, and a short mastery check.

15
minutes
6
lesson parts
11
practice items
Learning goal

Students will build Grade 6 mastery of data displays extended using models, equations, and test-style reasoning.

Student goal: I can solve problems involving data displays extended.

Helpful first: Circle Graphs
concept

Learn the Idea

Data Displays Extended means reading, creating, and explaining displays so data can answer real questions.

  • Read the title, labels, and scale before answering.
  • Use the scale value instead of counting marks as ones when the graph is scaled.
  • Compare categories by subtracting or adding values from the display.
  • Explain what the data shows in a complete sentence.
visual model

See the Math

Visual Model 1

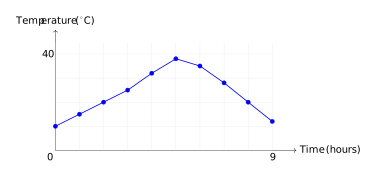
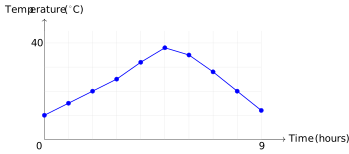
Question: This line graph shows how outdoor temperature changed from 6 AM to 3 PM. Which statement is TRUE?
Visual Model 1

  • A. Temperature peaked around noon (5 hours after start)
  • B. Temperature decreased continuously all day
  • C. Temperature was highest at 6 AM
  • D. Temperature was constant throughout the day

Why it works: The graph shows the line reaching its highest point at the 5-hour mark, which corresponds to noon. The other statements contradict the visual data.

Answer: Temperature peaked around noon
worked example

Follow a Worked Example

Example 1

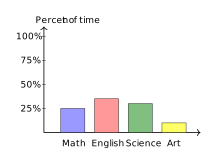
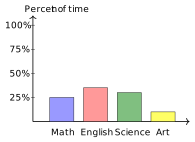
Question: The bar graph shows how a student spent 20 hours studying different subjects, by percent of total time. How many hours were spent on Science?

Example 1

  • A. 6 hours
  • B. 4 hours
  • C. 5 hours
  • D. 8 hours
  1. Science takes up 30% of the bar (1.2 out of 4 units), which is 0.3 \(\times\) 20 = 6 hours.

Answer: 6 hours

Example 2

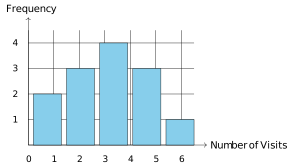
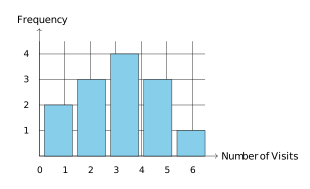
Question: This histogram shows the number of gym visits students made in a month. How many students visited the gym 2 or 3 times?

Example 2

  • A. 4
  • B. 8
  • C. 11
  • D. 7
  1. The bars for 2 visits and 3 visits have heights of 3 and 4 respectively.
  2. Total: 3 + 4 = 7 students.

Answer: 7 students

real world

Connect It to a Real Situation

Problem 1

Question: A double-bar graph compares the number of books read by boys and girls over 3 months. In January, boys read 24 books and girls read 18. In February, boys read 30 and girls read 28. In March, boys read 26 and girls read 32.
In which month did girls read more books than boys?

  • A. January
  • B. None
  • C. February
  • D. March

Why it works: In March, girls read 32 books and boys read 26 books. Since 32 > 26, girls read more in March only.

Answer: March

strategy

Avoid Mistakes and Choose a Strategy

  • Ignoring the graph scale.
  • Reading the wrong category or axis label.
  • Answering a comparison question without subtracting.
  • Writing a number without explaining what it represents.
  • Circle the scale before using the graph.
  • Write down the value for each category you compare.
  • Use addition for totals and subtraction for differences.
  • Answer in words so the data result has meaning.
summary

Remember the Key Idea

Data Displays Extended becomes easier when students connect the question to a model, use clear steps, and explain why the answer fits.

GOLDEN RULE

Read the scale before reading the answer.

Guided to independent practice

Solve before opening the answer

Use scratch paper. The explanation matters more than simply seeing whether the choice is correct.

warmup

2 questions
G6-C05-T11-Q001 About 1 min

Which data display is BEST for showing how a single numerical variable is distributed across many values?

  1. A Bar graph
  2. B Histogram
  3. C Pictograph
  4. D Circle graph
Check answer and explanation

Answer B: Histogram

A histogram groups continuous numerical data into intervals and shows frequency, making it ideal for displaying distribution. Bar graphs show categorical counts; pictographs use symbols; circle graphs show parts of a whole.

G6-C05-T11-Q002 About 1 min

A science class recorded the heights of 50 plants in cm: 8, 12, 15, 18, 20, 21, 22, 23, 25, 26, 28, 30, 31, 33, 35, 38, 40, 42, 44, 46, 48, 50, 52, 54, 55, 57, 59, 61, 62, 64, 65, 67, 68, 70, 72, 74, 75, 77, 78, 80, 82, 84, 85, 87, 88, 90, 92, 94, 95, 98.
Which display would be BEST for showing the spread and frequency of plant heights?

  1. A Bar graph showing each height
  2. B Pictograph with plant symbols
  3. C Circle graph dividing by plant type
  4. D Histogram with intervals of 10 cm
Check answer and explanation

Answer D: Histogram with intervals of 10 cm

With 50 continuous numerical values, a histogram groups them into intervals (e.g., 0–10, 11–20, etc.) to show the distribution pattern. A bar graph for each individual height would be too crowded; circle and pictographs don't display numerical distributions.

guided

1 question
G6-C05-T11-Q003 About 1 min

Maria surveyed her class about favorite sports: soccer, basketball, baseball, and tennis. The results were: soccer 12, basketball 8, baseball 7, tennis 3.
What is the PRIMARY purpose of using a bar graph to display this data?

  1. A To compare counts across different categories
  2. B To show how the data changes over time
  3. C To display parts of a whole
  4. D To reveal the median and quartiles
Check answer and explanation

Answer A: To compare counts across different categories

Bar graphs excel at comparing values across categories (sports in this case). Line graphs show trends over time; circle graphs show parts of a whole; box plots display quartiles.

practice

5 questions
G6-C05-T11-Q004 About 1 min

This line graph shows how outdoor temperature changed from 6 AM to 3 PM. Which statement is TRUE?

Data Displays Extended visual for G6-C05-T11-Q004
  1. A Temperature peaked around noon (5 hours after start)
  2. B Temperature decreased continuously all day
  3. C Temperature was highest at 6 AM
  4. D Temperature was constant throughout the day
Check answer and explanation

Answer A: Temperature peaked around noon (5 hours after start)

The graph shows the line reaching its highest point at the 5-hour mark, which corresponds to noon. The other statements contradict the visual data.

G6-C05-T11-Q005 About 1 min

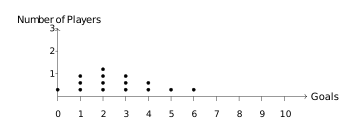
A dot plot shows the number of goals scored by soccer players in one season: How many players scored 2 or 3 goals?

Data Displays Extended visual for G6-C05-T11-Q005
  1. A 4
  2. B 3
  3. C 6
  4. D 7
Check answer and explanation

Answer D: 7

The dot plot shows 4 dots above 2 goals and 3 dots above 3 goals. Adding: 4 + 3 = 7 players.

G6-C05-T11-Q006 About 1 min

Which characteristic is MOST important when deciding to use a dot plot instead of a histogram?

  1. A You need to show the median only
  2. B The dataset is small and you want to see each value
  3. C The dataset is large (over 100 points)
  4. D The data represents categories, not numbers
Check answer and explanation

Answer B: The dataset is small and you want to see each value

Dot plots work best for small datasets where each individual value matters. Histograms are better for large datasets. Dot plots require numerical data, not categories.

G6-C05-T11-Q007 About 1 min

The bar graph shows how a student spent 20 hours studying different subjects, by percent of total time. How many hours were spent on Science?

Data Displays Extended visual for G6-C05-T11-Q007
  1. A 6 hours
  2. B 4 hours
  3. C 5 hours
  4. D 8 hours
Check answer and explanation

Answer A: 6 hours

Science takes up 30% of the bar (1.2 out of 4 units), which is 0.3 \(\times\) 20 = 6 hours.

G6-C05-T11-Q008 About 1 min

A box plot shows the distribution of test scores for a class. The median is 78, Q1 is 65, Q3 is 88, the minimum is 45, and the maximum is 95.
Which statement about the data is CORRECT?

  1. A Exactly 50% of students scored between 65 and 88
  2. B The range is 30 points
  3. C All students scored above 78
  4. D The interquartile range is 23 points
Check answer and explanation

Answer A: Exactly 50% of students scored between 65 and 88

Q1 to Q3 contains the middle 50% of data. The range is 95 − 45 = 50; not all scored above 78 (median); IQR = 88 − 65 = 23, which matches choice D. But A is the best description of what the box represents.

exit

3 questions
G6-C05-T11-Q009 About 1 min

A double-bar graph compares the number of books read by boys and girls over 3 months. In January, boys read 24 books and girls read 18. In February, boys read 30 and girls read 28. In March, boys read 26 and girls read 32.
In which month did girls read more books than boys?

  1. A January
  2. B None
  3. C February
  4. D March
Check answer and explanation

Answer D: March

In March, girls read 32 books and boys read 26 books. Since 32 > 26, girls read more in March only.

G6-C05-T11-Q010 About 1 min

This histogram shows the number of gym visits students made in a month. How many students visited the gym 2 or 3 times?

Data Displays Extended visual for G6-C05-T11-Q010
  1. A 4
  2. B 8
  3. C 11
  4. D 7
Check answer and explanation

Answer D: 7

The bars for 2 visits and 3 visits have heights of 3 and 4 respectively. Total: 3 + 4 = 7 students.

G6-C05-T11-Q011 About 1 min

A circle graph (pie chart) shows the distribution of 360 students by lunch preference: pizza 120 students, tacos 90 students, salad 60 students, other 90 students.
What angle in degrees should the pizza section span?

  1. A 180 degrees
  2. B 90 degrees
  3. C 60 degrees
  4. D 120 degrees
Check answer and explanation

Answer D: 120 degrees

Pizza accounts for \(\frac{120}{360} = \frac{1}{3}\) of students. The angle is \(\frac{1}{3} \times 360° = 120°\).

Page UP