Which data display is BEST for showing how a single numerical variable is distributed across many values?
- Bar graph
- Histogram
- Pictograph
- Circle graph


Students will build Grade 6 mastery of data displays extended using models, equations, and test-style reasoning.
Which data display is BEST for showing how a single numerical variable is distributed across many values?
A science class recorded the heights of 50 plants in cm: 8, 12, 15, 18, 20, 21, 22, 23, 25, 26, 28, 30, 31, 33, 35, 38, 40, 42, 44, 46, 48, 50, 52, 54, 55, 57, 59, 61, 62, 64, 65, 67, 68, 70, 72, 74, 75, 77, 78, 80, 82, 84, 85, 87, 88, 90, 92, 94, 95, 98.
Which display would be BEST for showing the spread and frequency of plant heights?
Maria surveyed her class about favorite sports: soccer, basketball, baseball, and tennis. The results were: soccer 12, basketball 8, baseball 7, tennis 3.
What is the PRIMARY purpose of using a bar graph to display this data?
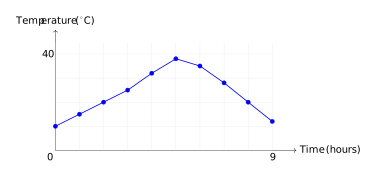
This line graph shows how outdoor temperature changed from 6 AM to 3 PM. Which statement is TRUE?
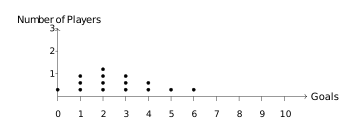
A dot plot shows the number of goals scored by soccer players in one season: How many players scored 2 or 3 goals?
Which characteristic is MOST important when deciding to use a dot plot instead of a histogram?
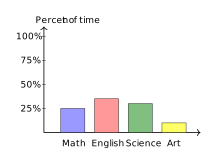
The bar graph shows how a student spent 20 hours studying different subjects, by percent of total time. How many hours were spent on Science?
A double-bar graph compares the number of books read by boys and girls over 3 months. In January, boys read 24 books and girls read 18. In February, boys read 30 and girls read 28. In March, boys read 26 and girls read 32.
In which month did girls read more books than boys?
A histogram groups continuous numerical data into intervals and shows frequency, making it ideal for displaying distribution. Bar graphs show categorical counts; pictographs use symbols; circle graphs show parts of a whole.
With 50 continuous numerical values, a histogram groups them into intervals (e.g., 0–10, 11–20, etc.) to show the distribution pattern. A bar graph for each individual height would be too crowded; circle and pictographs don't display numerical distributions.
Bar graphs excel at comparing values across categories (sports in this case). Line graphs show trends over time; circle graphs show parts of a whole; box plots display quartiles.
The graph shows the line reaching its highest point at the 5-hour mark, which corresponds to noon. The other statements contradict the visual data.
The dot plot shows 4 dots above 2 goals and 3 dots above 3 goals. Adding: 4 + 3 = 7 players.
Dot plots work best for small datasets where each individual value matters. Histograms are better for large datasets. Dot plots require numerical data, not categories.
Science takes up 30% of the bar (1.2 out of 4 units), which is 0.3 \(\times\) 20 = 6 hours.
In March, girls read 32 books and boys read 26 books. Since 32 > 26, girls read more in March only.
