Which of the following describes the CENTER of a data set?
- Range
- Median
- Interquartile range
- Maximum value


Students will build Grade 6 mastery of describing data: center, spread, and shape using models, equations, and test-style reasoning.
Which of the following describes the CENTER of a data set?
What is the mean of the data set: \(3, 5, 7, 9, 11\)?
Find the median of: \(2, 8, 4, 6, 10, 5, 3\).
Which measure describes the SPREAD of a data set?
What is the range of the data set: \(12, 28, 5, 45, 19\)?
What is the mode of: \(1, 2, 2, 3, 3, 3, 4\)?
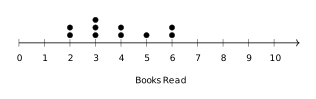
The dot plot below shows the number of books read by students in one month. What is the median number of books read?
A data set has a mean of 15 and a median of 12. What does this tell us about the shape of the data?
Measures of center include the mean and median. Range, interquartile range, and maximum describe the spread or extremes of the data.
Sum = \(3 + 5 + 7 + 9 + 11 = 35\). Mean = \(35 \div 5 = 7\).
Order the data: \(2, 3, 4, 5, 6, 8, 10\). The middle value is the 4th value, which is 5.
Spread measures include range, interquartile range (IQR), and mean absolute deviation (MAD). Mean and median are measures of center; mode is the most frequent value.
Range = Maximum \(-\) Minimum = \(45 - 5 = 40\).
The mode is the value that appears most often. The value 3 appears three times.
Data: \(2, 2, 3, 3, 3, 4, 4, 5, 6, 6\) (10 values). Median is average of 5th and 6th values: \((3 + 3) / 2 = 3\).
When mean > median, the data is skewed right. The mean is pulled toward the larger outliers on the right.
