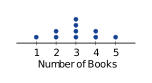
The dot plot shows the number of books read by students last month. How many students read exactly \(3\) books?
- \(2\)
- \(3\)
- \(4\)
- \(5\)


Students will build Grade 6 mastery of dot plots and histograms using models, equations, and test-style reasoning.
The dot plot shows the number of books read by students last month. How many students read exactly \(3\) books?
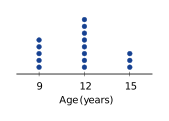
A dot plot displays the ages of people visiting an ice cream shop. The dot plot shows \(5\) people aged \(9\) years old, \(8\) people aged \(12\) years old, and \(3\) people aged \(15\) years old. How many total people are represented in the dot plot?
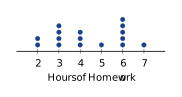
The dot plot below shows the number of hours sixth graders spent doing homework in one week. What is the mode (most common value) of the data?
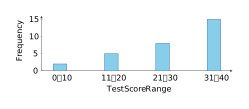
A histogram shows the test scores for a class of 30 students, grouped into ranges. The bars show: \(0\)--\(10\) has height \(2\), \(11\)--\(20\) has height \(5\), \(21\)--\(30\) has height \(8\), and \(31\)--\(40\) has height \(15\). How many students scored between \(21\) and \(30\)?
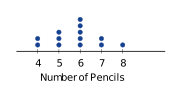
A dot plot shows the number of pencils in each student's pencil case. Which statement is true about the data?
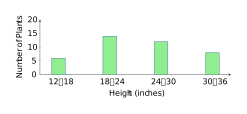
The histogram below shows the height (in inches) of tomato plants after \(4\) weeks. How many plants are between \(18\) and \(24\) inches tall?
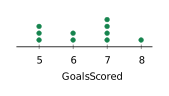
A dot plot shows the number of goals scored by different soccer teams during a season. If the dot plot shows \(3\) teams scored \(5\) goals, \(2\) teams scored \(6\) goals, \(4\) teams scored \(7\) goals, and \(1\) team scored \(8\) goals, what is the total number of goals scored by all teams combined?
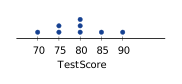
A dot plot displays the test scores: \(70, 75, 75, 80, 80, 80, 85, 90\). What is the median score?
Count the dots above the number \(3\): there are \(4\) dots, so \(4\) students read exactly \(3\) books.
Add the number of people at each age: \(5 + 8 + 3 = 16\) total people.
Count the dots stacked above each value. The tallest stack is at \(6\) hours with \(5\) dots, which is more than at any other value, so \(6\) hours is the mode.
The bar for the \(21\)--\(30\) range has a height of \(8\), which represents the frequency (number of students) in that range.
The value \(6\) has the most dots (\(5\)), making it the mode. The other statements are false: only \(2\) have \(4\) pencils, and there are \(2\) with \(7\) pencils.
The bar for the \(18\)--\(24\) inch range has a height of \(14\), representing the number of plants in that height range.
Calculate: \((3 \times 5) + (2 \times 6) + (4 \times 7) + (1 \times 8) = 15 + 12 + 28 + 8 = 63\) goals.
Order the data: \(70, 75, 75, 80, 80, 80, 85, 90\). There are \(8\) values, so the median is the average of the \(4\)th and \(5\)th values. Both are \(80\), so the median is \(\frac{80+80}{2}=80\).
