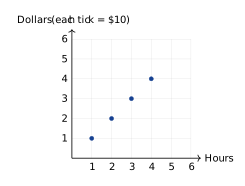
The coordinate plane shows ordered pairs representing the ratio of hours worked to dollars earned. Based on the graph, how much is earned per hour?
- \($1\) per hour
- \($5\) per hour
- \($10\) per hour
- \($20\) per hour


Students will build Grade 6 mastery of graphing ratios using models, equations, and test-style reasoning.
The coordinate plane shows ordered pairs representing the ratio of hours worked to dollars earned. Based on the graph, how much is earned per hour?
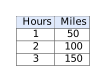
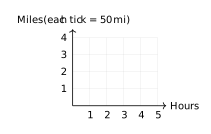
A ratio table shows the relationship between hours and miles traveled at a constant speed. Which graph correctly represents the data from this table? Looking at the coordinate plane below, which set of points matches this ratio?
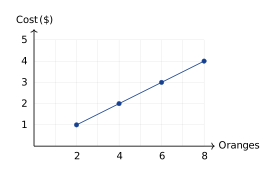
A store sells oranges at a constant rate. The graph below shows the relationship between the number of oranges and the total cost in dollars. What is the unit rate (cost per orange)?
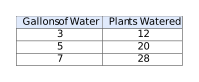
This table shows the relationship between gallons of water used and plants watered at a greenhouse. If this relationship is graphed with gallons on the x-axis and plants on the y-axis, what does the point \((1, 4)\) represent?
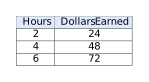
A student created this ratio table about babysitting rates: If the student plots \((0, 0)\), \((2, 24)\), \((4, 48)\), and \((6, 72)\) on a coordinate plane, which statement about the points is true?
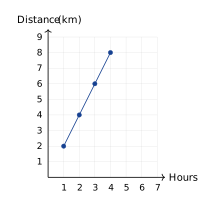
Which scenario best matches the graph showing hours on the x-axis and total distance in kilometers on the y-axis?
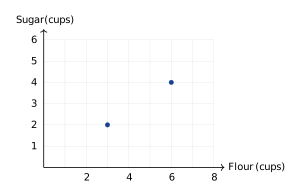
A recipe uses a 3:2 ratio of flour to sugar. The graph below shows ordered pairs of this ratio. Which point should also be plotted to continue this ratio pattern?
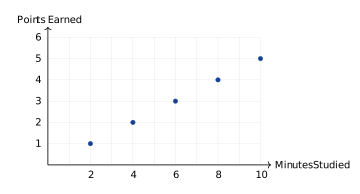
The graph shows the relationship between minutes studied and test score points earned. What is the unit rate (points per minute)?
Look at the y-axis label: each tick on the dollars axis stands for $10. The point \((1,1)\) means \(1\) hour and \(1\times10=$10\), so the rate is \($10\) per hour.
The vertical axis is scaled in groups of \(50\) miles. So \(50\) miles is shown as \(1\), \(100\) miles as \(2\), and \(150\) miles as \(3\), giving the points \((1,1)\), \((2,2)\), and \((3,3)\).
At the point where oranges \(= 2\), cost \(= $1\), giving a ratio of \($1 \div 2 = $0.50\) per orange. Or use any point: at \((8, 4)\), the rate is \($4 \div 8 = $0.50\) per orange.
On the graph with gallons on the x-axis and plants on the y-axis, the point \((1, 4)\) means 1 gallon (x-value) corresponds to 4 plants watered (y-value). This shows the unit rate: 4 plants per gallon.
All these points lie on a straight line passing through \((0, 0)\) because the ratio is constant (\(12\) dollars per hour). Proportional relationships always graph as straight lines through the origin.
Using two points on the line, e.g., \((1,2)\) and \((2,4)\): slope \(=\frac{4-2}{2-1}=2\) km/hr. Verify with \((4,8)\): \(8\div 4=2\) km/hr. The constant rate is \(2\) km per hour.
The ratio is 3:2 (flour:sugar). Points on this line satisfy \(\text{sugar} = \frac{2}{3} \times \text{flour}\). Check: \((3, 2)\) gives \(2 = \frac{2}{3}(3)\) ✓; \((6, 4)\) gives \(4 = \frac{2}{3}(6)\) ✓; \((9, 6)\) gives \(6 = \frac{2}{3}(9)\) ✓. The other options do not maintain this ratio.
Using the point \((2, 1)\): unit rate \(= 1 \div 2 = 0.5\) points per minute. Or from \((10, 5)\): unit rate \(= 5 \div 10 = 0.5\) points per minute.
