CH01-06 lesson

Graphing Ratios Learning Activity

A focused Grade 6 learning session for Graphing Ratios using visual models, worked examples, strategy guidance, and a short mastery check.

15
minutes
6
lesson parts
11
practice items
Learning goal

Students will build Grade 6 mastery of graphing ratios using models, equations, and test-style reasoning.

Student goal: I can solve problems involving graphing ratios.

concept

Learn the Idea

Graphing Ratios means reading, creating, and explaining displays so data can answer real questions.

  • Read the title, labels, and scale before answering.
  • Use the scale value instead of counting marks as ones when the graph is scaled.
  • Compare categories by subtracting or adding values from the display.
  • Explain what the data shows in a complete sentence.
visual model

See the Math

Visual Model 1

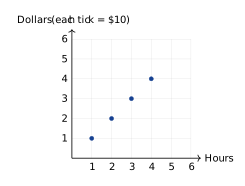
Question: The coordinate plane shows ordered pairs representing the ratio of hours worked to dollars earned. Based on the graph, how much is earned per hour?

Visual Model 1

  • A. \($1\) per hour
  • B. \($5\) per hour
  • C. \($10\) per hour
  • D. \($20\) per hour

Why it works: Look at the y-axis label: each tick on the dollars axis stands for $10. The point \((1,1)\) means \(1\) hour and \(1\times10=$10\), so the rate is \($10\) per hour.

Answer: \($10\) per hour

worked example

Follow a Worked Example

Example 1

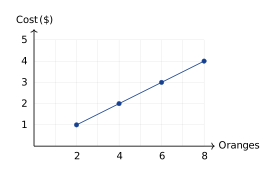
Question: A store sells oranges at a constant rate. The graph below shows the relationship between the number of oranges and the total cost in dollars. What is the unit rate (cost per orange)?

Example 1

  • A. \($0.25\) per orange
  • B. \($2.00\) per orange
  • C. \($1.00\) per orange
  • D. \($0.50\) per orange
  1. At the point where oranges \(= 2\), cost \(= $1\), giving a ratio of \($1 \div 2 = $0.50\) per orange.
  2. Or use any point: at \((8, 4)\), the rate is \($4 \div 8 = $0.50\) per orange.

Answer: \($0.50\) per orange

Example 2

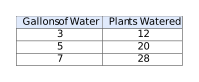
Question: This table shows the relationship between gallons of water used and plants watered at a greenhouse. If this relationship is graphed with gallons on the x-axis and plants on the y-axis, what does the point \((1, 4)\) represent?

Gallons of WaterPlants Watered
312
520
728
  • A. 1 gallon waters 4 plants
  • B. 4 gallons water 1 plant
  • C. 1 plant needs 4 gallons
  • D. 4 gallons water 4 plants
  1. On the graph with gallons on the x-axis and plants on the y-axis, the point \((1, 4)\) means 1 gallon (x-value) corresponds to 4 plants watered (y-value).
  2. This shows the unit rate: 4 plants per gallon.

Answer: 1 gallon waters 4 plants

real world

Connect It to a Real Situation

Problem 1

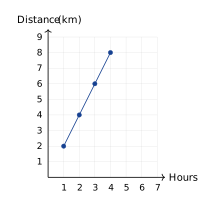
Question: Which scenario best matches the graph showing hours on the x-axis and total distance in kilometers on the y-axis?

Problem 1

  • A. Traveling at 2 km per hour
  • B. Traveling at 4 km per hour
  • C. Traveling at 6 km per hour
  • D. Traveling at 8 km per hour

Why it works: Using two points on the line, e.g., \((1,2)\) and \((2,4)\): slope \(=\frac{4-2}{2-1}=2\) km/hr. Verify with \((4,8)\): \(8\div 4=2\) km/hr. The constant rate is \(2\) km per hour.

Answer: Traveling at 2 km per hour

strategy

Avoid Mistakes and Choose a Strategy

  • Ignoring the graph scale.
  • Reading the wrong category or axis label.
  • Answering a comparison question without subtracting.
  • Writing a number without explaining what it represents.
  • Circle the scale before using the graph.
  • Write down the value for each category you compare.
  • Use addition for totals and subtraction for differences.
  • Answer in words so the data result has meaning.
summary

Remember the Key Idea

Graphing Ratios becomes easier when students connect the question to a model, use clear steps, and explain why the answer fits.

GOLDEN RULE

Read the scale before reading the answer.

Guided to independent practice

Solve before opening the answer

Use scratch paper. The explanation matters more than simply seeing whether the choice is correct.

warmup

2 questions
G6-C01-T06-Q001 About 1 min

The coordinate plane shows ordered pairs representing the ratio of hours worked to dollars earned. Based on the graph, how much is earned per hour?

Graphing Ratios visual for G6-C01-T06-Q001
  1. A \($1\) per hour
  2. B \($5\) per hour
  3. C \($10\) per hour
  4. D \($20\) per hour
Check answer and explanation

Answer C: \($10\) per hour

Look at the y-axis label: each tick on the dollars axis stands for $10. The point \((1,1)\) means \(1\) hour and \(1\times10=$10\), so the rate is \($10\) per hour.

G6-C01-T06-Q002 About 1 min

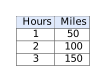
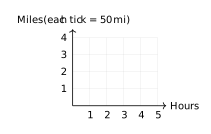
A ratio table shows the relationship between hours and miles traveled at a constant speed. Which graph correctly represents the data from this table? Looking at the coordinate plane below, which set of points matches this ratio?

Graphing Ratios visual for G6-C01-T06-Q002 Graphing Ratios visual for G6-C01-T06-Q002
  1. A \((1,1), (2,2), (3,3)\)
  2. B \((1,2), (2,4), (3,6)\)
  3. C \((1,5), (2,7), (3,9)\)
  4. D \((1,3), (2,6), (3,9)\)
Check answer and explanation

Answer A: \((1,1), (2,2), (3,3)\)

The vertical axis is scaled in groups of \(50\) miles. So \(50\) miles is shown as \(1\), \(100\) miles as \(2\), and \(150\) miles as \(3\), giving the points \((1,1)\), \((2,2)\), and \((3,3)\).

guided

1 question
G6-C01-T06-Q003 About 1 min

A store sells oranges at a constant rate. The graph below shows the relationship between the number of oranges and the total cost in dollars. What is the unit rate (cost per orange)?

Graphing Ratios visual for G6-C01-T06-Q003
  1. A \($0.25\) per orange
  2. B \($2.00\) per orange
  3. C \($1.00\) per orange
  4. D \($0.50\) per orange
Check answer and explanation

Answer D: \($0.50\) per orange

At the point where oranges \(= 2\), cost \(= $1\), giving a ratio of \($1 \div 2 = $0.50\) per orange. Or use any point: at \((8, 4)\), the rate is \($4 \div 8 = $0.50\) per orange.

practice

5 questions
G6-C01-T06-Q004 About 1 min

This table shows the relationship between gallons of water used and plants watered at a greenhouse. If this relationship is graphed with gallons on the x-axis and plants on the y-axis, what does the point \((1, 4)\) represent?

Graphing Ratios visual for G6-C01-T06-Q004
  1. A 1 gallon waters 4 plants
  2. B 4 gallons water 1 plant
  3. C 1 plant needs 4 gallons
  4. D 4 gallons water 4 plants
Check answer and explanation

Answer A: 1 gallon waters 4 plants

On the graph with gallons on the x-axis and plants on the y-axis, the point \((1, 4)\) means 1 gallon (x-value) corresponds to 4 plants watered (y-value). This shows the unit rate: 4 plants per gallon.

G6-C01-T06-Q005 About 1 min

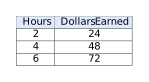
A student created this ratio table about babysitting rates: If the student plots \((0, 0)\), \((2, 24)\), \((4, 48)\), and \((6, 72)\) on a coordinate plane, which statement about the points is true?

Graphing Ratios visual for G6-C01-T06-Q005
  1. A The points form a vertical line
  2. B The points form a diagonal line through the origin
  3. C The points form a horizontal line
  4. D The points do not form a straight line
Check answer and explanation

Answer B: The points form a diagonal line through the origin

All these points lie on a straight line passing through \((0, 0)\) because the ratio is constant (\(12\) dollars per hour). Proportional relationships always graph as straight lines through the origin.

G6-C01-T06-Q006 About 1 min

Which scenario best matches the graph showing hours on the x-axis and total distance in kilometers on the y-axis?

Graphing Ratios visual for G6-C01-T06-Q006
  1. A Traveling at 2 km per hour
  2. B Traveling at 4 km per hour
  3. C Traveling at 6 km per hour
  4. D Traveling at 8 km per hour
Check answer and explanation

Answer A: Traveling at 2 km per hour

Using two points on the line, e.g., \((1,2)\) and \((2,4)\): slope \(=\frac{4-2}{2-1}=2\) km/hr. Verify with \((4,8)\): \(8\div 4=2\) km/hr. The constant rate is \(2\) km per hour.

G6-C01-T06-Q007 About 1 min

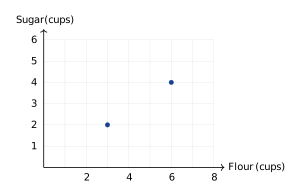
A recipe uses a 3:2 ratio of flour to sugar. The graph below shows ordered pairs of this ratio. Which point should also be plotted to continue this ratio pattern?

Graphing Ratios visual for G6-C01-T06-Q007
  1. A \((4, 3)\)
  2. B \((9, 6)\)
  3. C \((5, 4)\)
  4. D \((8, 5)\)
Check answer and explanation

Answer B: \((9, 6)\)

The ratio is 3:2 (flour:sugar). Points on this line satisfy \(\text{sugar} = \frac{2}{3} \times \text{flour}\). Check: \((3, 2)\) gives \(2 = \frac{2}{3}(3)\) ✓; \((6, 4)\) gives \(4 = \frac{2}{3}(6)\) ✓; \((9, 6)\) gives \(6 = \frac{2}{3}(9)\) ✓. The other options do not maintain this ratio.

G6-C01-T06-Q008 About 1 min

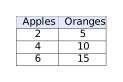
A ratio table shows the number of apples and oranges in a fruit basket. If this ratio is graphed with apples on the x-axis, what is the y-coordinate when the x-coordinate is 8?

Graphing Ratios visual for G6-C01-T06-Q008
  1. A 18
  2. B 24
  3. C 22
  4. D 20
Check answer and explanation

Answer D: 20

The ratio is apples to oranges at 2:5. For every 2 apples, there are 5 oranges. When apples = 8, the multiplier is \(8 \div 2 = 4\). So oranges = \(5 \times 4 = 20\).

exit

3 questions
G6-C01-T06-Q009 About 1 min

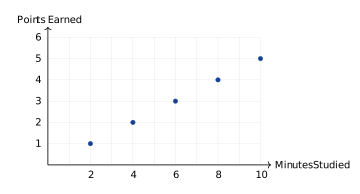
The graph shows the relationship between minutes studied and test score points earned. What is the unit rate (points per minute)?

Graphing Ratios visual for G6-C01-T06-Q009
  1. A \(0.25\) points per minute
  2. B \(0.5\) points per minute
  3. C \(1\) point per minute
  4. D \(2\) points per minute
Check answer and explanation

Answer B: \(0.5\) points per minute

Using the point \((2, 1)\): unit rate \(= 1 \div 2 = 0.5\) points per minute. Or from \((10, 5)\): unit rate \(= 5 \div 10 = 0.5\) points per minute.

G6-C01-T06-Q010 About 1 min

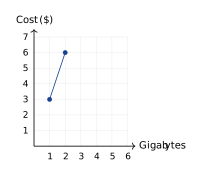
A cell phone plan charges a constant rate per gigabyte of data used. The graph below shows this relationship. What does the point \((1, 3)\) represent?

Graphing Ratios visual for G6-C01-T06-Q010
  1. A 1 GB costs 3 dollars
  2. B 3 GB costs 1 dollar
  3. C 1 dollar buys 3 GB
  4. D 1 GB costs 1 dollar
Check answer and explanation

Answer A: 1 GB costs 3 dollars

On a graph with gigabytes on the x-axis and cost on the y-axis, the point \((1, 3)\) means 1 gigabyte (x-value) costs $3 dollars (y-value).

G6-C01-T06-Q011 About 1 min

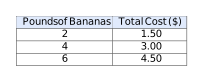
A fruit vendor sells bananas at a constant price. This table shows the relationship: Which equation represents the relationship between pounds (\(p\)) and cost (\(c\))?

Graphing Ratios visual for G6-C01-T06-Q011
  1. A \(c = 0.5p\)
  2. B \(c = 0.75p\)
  3. C \(c = 1.5p\)
  4. D \(c = 3p\)
Check answer and explanation

Answer B: \(c = 0.75p\)

For 2 pounds, cost is \($1.50\), so the unit rate is \(1.50 \div 2 = 0.75\) per pound. Check: \(c = 0.75p\) gives \(c = 0.75(2) = 1.50\) ✓ and \(c = 0.75(4) = 3.00\) ✓.

Page UP