A stem-and-leaf plot of test scores has stem \(7\) with leaves \(2, 5, 8\). Which values are represented?
- \(27, 57, 87\)
- \(72, 75, 78\)
- \(70, 71, 72\)
- \(7.2, 7.5, 7.8\)


Students will build Grade 6 mastery of stem-and-leaf plots using models, equations, and test-style reasoning.
A stem-and-leaf plot of test scores has stem \(7\) with leaves \(2, 5, 8\). Which values are represented?
The stem-and-leaf plot below shows the heights (in cm) of students in a class. What is the minimum height?
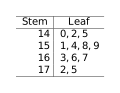
Using the same stem-and-leaf plot from Question 2, what is the maximum height?
Using the same stem-and-leaf plot from Question 2, what is the range of heights?
A stem-and-leaf plot shows daily temperatures (in \(°\)F) recorded during winter: How many temperatures are recorded?
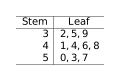
Using the temperature data from Question 5, what is the median temperature?
Using the temperature data from Question 5, which temperature appears most frequently (the mode)?
In the stem-and-leaf plot above (Question 8), how many scores are in the 70s?
In a stem-and-leaf plot, each leaf combines with the stem to form a value. Stem \(7\) with leaves \(2, 5, 8\) represents \(72, 75, 78\).
The smallest value in the plot is found by taking the smallest stem (14) with its smallest leaf (0), giving \(140\) cm.
The largest stem is 17, and the largest leaf for that stem is 5, so the maximum is \(175\) cm.
Range = Max \(-\) Min = \(175 - 140 = 35\) cm.
Count all leaves: \(3 + 4 + 3 = 10\) data points.
Order the data: \(32, 35, 39, 41, 44, 46, 48, 50, 53, 57\). With \(10\) values (an even count), the median is the average of the \(5\)th and \(6\)th values: \((44 + 46) \div 2 = 45°\)F.
Each temperature appears exactly once in the data, so there is no mode (or all are modes).
Stem \(7\) has leaves \(1, 3, 4, 6, 9\), which is \(5\) leaves total.
