A coin was flipped \(80\) times and came up heads \(36\) times. What is the experimental probability of getting heads?
- \(0.36\)
- \(0.45\)
- \(0.50\)
- \(0.56\)


Students will build Grade 7 mastery of experimental probability using models, equations, and test-style reasoning.
A coin was flipped \(80\) times and came up heads \(36\) times. What is the experimental probability of getting heads?
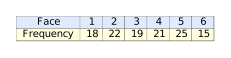
A six-sided die was rolled \(120\) times. The results are shown below. What is the experimental probability of rolling a \(5\)?
A spinner was spun \(200\) times with four equal sections labeled A, B, C, and D. Section A appeared \(58\) times. Which best describes the relationship between the experimental and theoretical probabilities for landing on A?
A basketball player attempted \(75\) free throws and made \(54\) of them. What is the experimental probability that the player makes the next free throw?
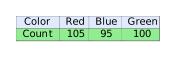
A bag contains marbles of three colors. Maria draws a marble, records the color, and replaces it. After \(300\) draws, the results are: If Maria draws one more marble, which color is she most likely to draw based on experimental probability?
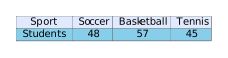
A survey of \(150\) students asked which sport they play. The results: Based on this data, what is the experimental probability that a randomly selected student plays basketball?
Two students tossed a coin. Student A tossed it \(50\) times and got heads \(24\) times. Student B tossed it \(500\) times and got heads \(256\) times. Which experimental probability is closer to the theoretical probability of \(0.5\)?
A dart was thrown at a target \(400\) times. It hit the bullseye \(92\) times. What is the experimental probability of hitting the bullseye?
Experimental probability \(=\frac{\text{observed outcomes}}{\text{total trials}}=\frac{36}{80}=0.45\). This is close to the theoretical probability of \(0.5\), showing how observed results approximate expected outcomes.
The face \(5\) appeared \(25\) times out of \(120\) total rolls. Experimental probability \(= \frac{25}{120}\). Note: this is slightly higher than the theoretical probability of \(\frac{1}{6}\).
Experimental probability (\(0.29\)) is based on observed data and differs from theoretical probability (\(0.25\)) because of random variation. Both values are relative frequencies—ratios of favorable outcomes to total trials.
Experimental probability \(=\frac{54}{75}=0.72\). This relative frequency represents the player's observed success rate and predicts future performance.
Red has the highest experimental probability: \(\frac{105}{300}=0.35\). From observed patterns, Red appeared most frequently, so we predict it is most likely on the next draw.
Basketball was chosen by \(57\) out of \(150\) students. Experimental probability \(= \frac{57}{150}\).
Student A: \(\frac{24}{50}=0.48\), difference \(0.02\) from \(0.5\). Student B: \(\frac{256}{500}=0.512\), difference \(0.012\) from \(0.5\). This illustrates the law of large numbers---larger sample sizes yield results closer to theoretical probability.
Experimental probability \(=\frac{92}{400}=0.23\). Distractors represent nearby decimal values that students might compute incorrectly.
