CH09-03 lesson

Experimental Probability Learning Activity

A focused Grade 7 learning session for Experimental Probability using visual models, worked examples, strategy guidance, and a short mastery check.

15
minutes
6
lesson parts
11
practice items
Learning goal

Students will build Grade 7 mastery of experimental probability using models, equations, and test-style reasoning.

Student goal: I can solve problems involving experimental probability.

Helpful first: Theoretical Probability
concept

Learn the Idea

Experimental Probability is part of Grade 7 Probability. This activity focuses on the central idea students need before they move into independent practice.

Students will build Grade 7 mastery of experimental probability using models, equations, and test-style reasoning.

visual model

See the Math

What to noticeHow to use it
Numbers, units, labels, diagrams, or graphsIdentify what each part represents before calculating.
The relationship in the problemConnect the model to an equation, comparison, or explanation.

Use the figures and worked questions in the practice set below as the visual model for this skill.

worked example

Follow a Worked Example

Read the first practice question slowly. Decide what the question is asking, choose a strategy, solve, and then compare your reasoning with the answer explanation.

For Experimental Probability, a strong worked example should show the setup, the calculation or model, and a final answer that matches the context.

real world

Connect It to a Real Situation

Many Grade 7 test questions use real situations. Look for quantities, units, rates, measures, expressions, or data values that connect the math to the story.

After solving, explain what the answer means in the situation, not just the number you calculated.

strategy

Avoid Mistakes and Choose a Strategy

  • Underline the exact question before solving.
  • Label units, variables, or graph axes when they appear.
  • Estimate first so unreasonable answers are easier to catch.
  • Review missed questions and write the reason for each mistake.
summary

Remember the Key Idea

I can solve problems involving experimental probability.

Use the warmup, guided question, practice set, and exit questions below to check whether this skill is ready or needs more practice.

Guided to independent practice

Solve before opening the answer

Use scratch paper. The explanation matters more than simply seeing whether the choice is correct.

warmup

2 questions
G7-C09-T03-Q001 About 1 min

A coin was flipped \(80\) times and came up heads \(36\) times. What is the experimental probability of getting heads?

  1. A \(0.36\)
  2. B \(0.45\)
  3. C \(0.50\)
  4. D \(0.56\)
Check answer and explanation

Answer B: \(0.45\)

Experimental probability \(=\frac{\text{observed outcomes}}{\text{total trials}}=\frac{36}{80}=0.45\). This is close to the theoretical probability of \(0.5\), showing how observed results approximate expected outcomes.
G7-C09-T03-Q002 About 1 min

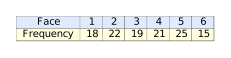
A six-sided die was rolled \(120\) times. The results are shown below. What is the experimental probability of rolling a \(5\)?

Experimental Probability visual for G7-C09-T03-Q002
  1. A \(\frac{25}{120}\)
  2. B \(\frac{7}{24}\)
  3. C \(\frac{1}{6}\)
  4. D \(\frac{15}{120}\)
Check answer and explanation

Answer A: \(\frac{25}{120}\)

The face \(5\) appeared \(25\) times out of \(120\) total rolls. Experimental probability \(= \frac{25}{120}\). Note: this is slightly higher than the theoretical probability of \(\frac{1}{6}\).

guided

1 question
G7-C09-T03-Q003 About 1 min

A spinner was spun \(200\) times with four equal sections labeled A, B, C, and D. Section A appeared \(58\) times. Which best describes the relationship between the experimental and theoretical probabilities for landing on A?

  1. A Both are exactly \(0.25\).
  2. B Experimental is \(0.58\); theoretical is \(0.20\).
  3. C Experimental is \(0.25\); theoretical is \(0.29\).
  4. D Experimental is \(0.29\); theoretical is \(0.25\).
Check answer and explanation

Answer D: Experimental is \(0.29\); theoretical is \(0.25\).

Experimental probability (\(0.29\)) is based on observed data and differs from theoretical probability (\(0.25\)) because of random variation. Both values are relative frequencies—ratios of favorable outcomes to total trials.

practice

5 questions
G7-C09-T03-Q004 About 1 min

A basketball player attempted \(75\) free throws and made \(54\) of them. What is the experimental probability that the player makes the next free throw?

  1. A \(0.54\)
  2. B \(0.60\)
  3. C \(0.67\)
  4. D \(0.72\)
Check answer and explanation

Answer D: \(0.72\)

Experimental probability \(=\frac{54}{75}=0.72\). This relative frequency represents the player's observed success rate and predicts future performance.

G7-C09-T03-Q005 About 1 min

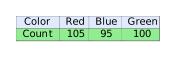
A bag contains marbles of three colors. Maria draws a marble, records the color, and replaces it. After \(300\) draws, the results are: If Maria draws one more marble, which color is she most likely to draw based on experimental probability?

Experimental Probability visual for G7-C09-T03-Q005
  1. A All equally likely
  2. B Blue
  3. C Green
  4. D Red
Check answer and explanation

Answer D: Red

Red has the highest experimental probability: \(\frac{105}{300}=0.35\). From observed patterns, Red appeared most frequently, so we predict it is most likely on the next draw.

G7-C09-T03-Q006 About 1 min

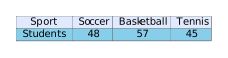
A survey of \(150\) students asked which sport they play. The results: Based on this data, what is the experimental probability that a randomly selected student plays basketball?

Experimental Probability visual for G7-C09-T03-Q006
  1. A \(\frac{57}{105}\)
  2. B \(\frac{48}{150}\)
  3. C \(\frac{57}{150}\)
  4. D \(\frac{45}{150}\)
Check answer and explanation

Answer C: \(\frac{57}{150}\)

Basketball was chosen by \(57\) out of \(150\) students. Experimental probability \(= \frac{57}{150}\).

G7-C09-T03-Q007 About 1 min

Two students tossed a coin. Student A tossed it \(50\) times and got heads \(24\) times. Student B tossed it \(500\) times and got heads \(256\) times. Which experimental probability is closer to the theoretical probability of \(0.5\)?

  1. A Student B (\(0.512\))
  2. B Cannot determine
  3. C Both are equally close
  4. D Student A (\(0.48\))
Check answer and explanation

Answer A: Student B (\(0.512\))

Student A: \(\frac{24}{50}=0.48\), difference \(0.02\) from \(0.5\). Student B: \(\frac{256}{500}=0.512\), difference \(0.012\) from \(0.5\). This illustrates the law of large numbers---larger sample sizes yield results closer to theoretical probability.

G7-C09-T03-Q008 About 1 min

A factory tests light bulbs for quality. Out of \(1000\) bulbs tested, \(980\) passed inspection. Based on this experimental data, how many bulbs out of \(5000\) would be expected to pass?

  1. A \(980\)
  2. B \(3900\)
  3. C \(4800\)
  4. D \(4900\)
Check answer and explanation

Answer D: \(4900\)

Experimental probability of passing \(=\frac{980}{1000}=0.98\). We use this rate to predict outcomes in a larger sample: \(0.98 \times 5000 = 4900\) expected passing bulbs.

exit

3 questions
G7-C09-T03-Q009 About 1 min

A dart was thrown at a target \(400\) times. It hit the bullseye \(92\) times. What is the experimental probability of hitting the bullseye?

  1. A \(0.20\)
  2. B \(0.23\)
  3. C \(0.25\)
  4. D \(0.30\)
Check answer and explanation

Answer B: \(0.23\)

Experimental probability \(=\frac{92}{400}=0.23\). Distractors represent nearby decimal values that students might compute incorrectly.

G7-C09-T03-Q010 About 1 min

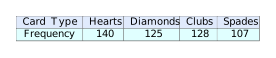
A frequency table shows results from drawing cards with replacement \(500\) times: Which suit has the lowest experimental probability?

Experimental Probability visual for G7-C09-T03-Q010
  1. A Hearts
  2. B Diamonds
  3. C Clubs
  4. D Spades
Check answer and explanation

Answer D: Spades

Compare relative frequencies: Hearts \(\frac{140}{500}=0.28\), Diamonds \(\frac{125}{500}=0.25\), Clubs \(\frac{128}{500}=0.256\), Spades \(\frac{107}{500}=0.214\). Spades has the lowest.

G7-C09-T03-Q011 About 1 min

A student rolled a number cube and recorded the results in a bar graph. Out of \(240\) rolls, the number \(6\) appeared in \(38\) rolls. What is the experimental probability of rolling a \(6\)?

  1. A \(\frac{1}{6}\)
  2. B \(\frac{38}{240}\)
  3. C \(0.19\)
  4. D \(0.60\)
Check answer and explanation

Answer B: \(\frac{38}{240}\)

Experimental probability = \(\frac{\text{observed favorable outcomes}}{\text{total trials}} = \frac{38}{240} \approx 0.158\). This is the relative frequency from the observed data.

Page UP