CH08-05 lesson

Stem-and-Leaf Plots Learning Activity

A focused Grade 7 learning session for Stem-and-Leaf Plots using visual models, worked examples, strategy guidance, and a short mastery check.

15
minutes
6
lesson parts
11
practice items
Learning goal

Students will build Grade 7 mastery of stem-and-leaf plots using models, equations, and test-style reasoning.

Student goal: I can solve problems involving stem-and-leaf plots.

concept

Learn the Idea

Stem-and-Leaf Plots is part of Grade 7 Statistics. This activity focuses on the central idea students need before they move into independent practice.

Students will build Grade 7 mastery of stem-and-leaf plots using models, equations, and test-style reasoning.

visual model

See the Math

What to noticeHow to use it
Numbers, units, labels, diagrams, or graphsIdentify what each part represents before calculating.
The relationship in the problemConnect the model to an equation, comparison, or explanation.

Use the figures and worked questions in the practice set below as the visual model for this skill.

worked example

Follow a Worked Example

Read the first practice question slowly. Decide what the question is asking, choose a strategy, solve, and then compare your reasoning with the answer explanation.

For Stem-and-Leaf Plots, a strong worked example should show the setup, the calculation or model, and a final answer that matches the context.

real world

Connect It to a Real Situation

Many Grade 7 test questions use real situations. Look for quantities, units, rates, measures, expressions, or data values that connect the math to the story.

After solving, explain what the answer means in the situation, not just the number you calculated.

strategy

Avoid Mistakes and Choose a Strategy

  • Underline the exact question before solving.
  • Label units, variables, or graph axes when they appear.
  • Estimate first so unreasonable answers are easier to catch.
  • Review missed questions and write the reason for each mistake.
summary

Remember the Key Idea

I can solve problems involving stem-and-leaf plots.

Use the warmup, guided question, practice set, and exit questions below to check whether this skill is ready or needs more practice.

Guided to independent practice

Solve before opening the answer

Use scratch paper. The explanation matters more than simply seeing whether the choice is correct.

warmup

2 questions
G7-C08-T05-Q001 About 1 min

A stem-and-leaf plot has stem \(3\) with leaves \(2, 5, 7, 8\). Which values does this represent?

  1. A \(23, 35, 37, 38\)
  2. B \(32, 35, 37, 38\)
  3. C \(2, 5, 7, 8\)
  4. D \(3.2, 3.5, 3.7, 3.8\)
Check answer and explanation

Answer B: \(32, 35, 37, 38\)

Each leaf combines with its stem: stem \(3\) + leaf \(2\) = \(32\), stem \(3\) + leaf \(5\) = \(35\), etc.
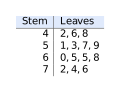
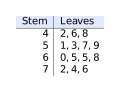
G7-C08-T05-Q002 About 1 min

The stem-and-leaf plot below shows test scores. What is the minimum score?

Stem-and-Leaf Plots visual for G7-C08-T05-Q002
  1. A \(42\)
  2. B \(41\)
  3. C \(40\)
  4. D \(48\)
Check answer and explanation

Answer A: \(42\)

The smallest stem is \(4\) with the smallest leaf \(2\), giving \(42\).

guided

1 question
G7-C08-T05-Q003 About 1 min

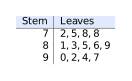
The stem-and-leaf plot below shows test scores. What is the maximum score?

Stem-and-Leaf Plots visual for G7-C08-T05-Q003
  1. A \(76\)
  2. B \(77\)
  3. C \(79\)
  4. D \(86\)
Check answer and explanation

Answer A: \(76\)

The largest stem is \(7\) with the largest leaf \(6\), giving \(76\).

practice

5 questions
G7-C08-T05-Q004 About 1 min

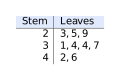
The stem-and-leaf plot shows heights (in cm) of students: How many students are represented?

Stem-and-Leaf Plots visual for G7-C08-T05-Q004
  1. A \(8\)
  2. B \(11\)
  3. C \(12\)
  4. D \(14\)
Check answer and explanation

Answer C: \(12\)

Count all leaves: \(3 + 4 + 3 + 2 = 12\) data points.

G7-C08-T05-Q005 About 1 min

A stem-and-leaf plot has stems \(5, 6, 7\) with leaves: What is the range of the data?

  1. A Stem \(5\): \(1, 4, 7\)
  2. B Stem \(6\): \(0, 3, 8\)
  3. C Stem \(7\): \(2, 6, 9\)
Check answer and explanation

Answer B: Stem \(6\): \(0, 3, 8\)

Minimum is \(51\), maximum is \(76\). Range \(= 76 - 51 = 25\).

G7-C08-T05-Q006 About 1 min

The stem-and-leaf plot shows: How many data values fall between \(30\) and \(40\) (inclusive)?

Stem-and-Leaf Plots visual for G7-C08-T05-Q006
  1. A \(2\)
  2. B \(3\)
  3. C \(4\)
  4. D \(5\)
Check answer and explanation

Answer C: \(4\)

Values in the range: \(31, 34, 34, 37\) (all from stem \(3\)) \(= 4\) values.

G7-C08-T05-Q007 About 1 min

In a stem-and-leaf plot, the stem represents the tens digit and leaves represent the ones digit. If a value is \(67\), what stem and leaf should be written?

  1. A Stem \(6\), Leaf \(7\)
  2. B Stem \(7\), Leaf \(6\)
  3. C Stem \(60\), Leaf \(7\)
  4. D Stem \(67\), Leaf \(1\)
Check answer and explanation

Answer A: Stem \(6\), Leaf \(7\)

The tens digit (\(6\)) is the stem; the ones digit (\(7\)) is the leaf.

G7-C08-T05-Q008 About 1 min

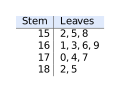
The stem-and-leaf plot displays class test scores: What is the median score?

Stem-and-Leaf Plots visual for G7-C08-T05-Q008
  1. A \(85\)
  2. B \(84\)
  3. C \(83\)
  4. D \(82\)
Check answer and explanation

Answer A: \(85\)

There are \(13\) values (odd). Ordered: \(72, 75, 78, 78, 81, 83, 85, 86, 89, 90, 92, 94, 97\). The 7th value is \(85\).

exit

3 questions
G7-C08-T05-Q009 About 1 min

A data set has values: \(12, 15, 15, 18, 21, 23, 24, 28\). Which is the correct stem-and-leaf plot?

  1. A Stem \(1\): \(2, 5, 5, 8\); Stem \(2\): \(1, 3, 4, 8\)
  2. B Stem \(1\): \(1, 2, 5, 5\); Stem \(2\): \(1, 3, 4, 8\)
  3. C Stem \(1\): \(2, 5, 5, 8\); Stem \(2\): \(3, 4, 8, 1\)
  4. D Stem \(1\): \(1, 2, 3, 4\); Stem \(2\): \(1, 5, 5, 8\)
Check answer and explanation

Answer A: Stem \(1\): \(2, 5, 5, 8\); Stem \(2\): \(1, 3, 4, 8\)

Leaves must be listed in order and correspond to the tens digit (stem).

G7-C08-T05-Q010 About 1 min

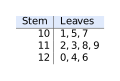
The stem-and-leaf plot shows: What is the mode?

Stem-and-Leaf Plots visual for G7-C08-T05-Q010
  1. A \(112\)
  2. B \(118\)
  3. C \(119\)
  4. D No mode
Check answer and explanation

Answer D: No mode

Each value appears exactly once, so there is no repeating value. There is no mode.

G7-C08-T05-Q011 About 1 min

Three-digit data in a stem-and-leaf plot with stem \(14\) and leaves \(2, 5, 8\) represents which values?

  1. A \(142, 145, 148\)
  2. B \(1402, 1405, 1408\)
  3. C \(14.2, 14.5, 14.8\)
  4. D \(214, 514, 814\)
Check answer and explanation

Answer A: \(142, 145, 148\)

With a two-digit stem (\(14\)), leaves are the ones place: \(142, 145, 148\).

Page UP