A stem-and-leaf plot has stem \(3\) with leaves \(2, 5, 7, 8\). Which values does this represent?
- \(23, 35, 37, 38\)
- \(32, 35, 37, 38\)
- \(2, 5, 7, 8\)
- \(3.2, 3.5, 3.7, 3.8\)


Students will build Grade 7 mastery of stem-and-leaf plots using models, equations, and test-style reasoning.
A stem-and-leaf plot has stem \(3\) with leaves \(2, 5, 7, 8\). Which values does this represent?
The stem-and-leaf plot below shows test scores. What is the minimum score?
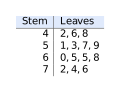
The stem-and-leaf plot below shows test scores. What is the maximum score?
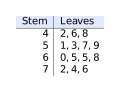
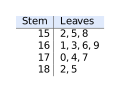
The stem-and-leaf plot shows heights (in cm) of students: How many students are represented?
A stem-and-leaf plot has stems \(5, 6, 7\) with leaves: What is the range of the data?
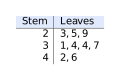
The stem-and-leaf plot shows: How many data values fall between \(30\) and \(40\) (inclusive)?
In a stem-and-leaf plot, the stem represents the tens digit and leaves represent the ones digit. If a value is \(67\), what stem and leaf should be written?
A data set has values: \(12, 15, 15, 18, 21, 23, 24, 28\). Which is the correct stem-and-leaf plot?
Each leaf combines with its stem: stem \(3\) + leaf \(2\) = \(32\), stem \(3\) + leaf \(5\) = \(35\), etc.
The smallest stem is \(4\) with the smallest leaf \(2\), giving \(42\).
The largest stem is \(7\) with the largest leaf \(6\), giving \(76\).
Count all leaves: \(3 + 4 + 3 + 2 = 12\) data points.
Minimum is \(51\), maximum is \(76\). Range \(= 76 - 51 = 25\).
Values in the range: \(31, 34, 34, 37\) (all from stem \(3\)) \(= 4\) values.
The tens digit (\(6\)) is the stem; the ones digit (\(7\)) is the leaf.
Leaves must be listed in order and correspond to the tens digit (stem).
