




Introduction
Comparing Populations with Measures of Center and Variability is an important Grade 7 math skill because students are moving from simple answers toward explaining how the math works.
In this lesson, students use models, real questions, worked examples, practice problems, and two online quizzes to build confidence with comparing populations with measures of center and variability.
What Is Comparing Populations with Measures of Center and Variability?
Comparing Populations with Measures of Center and Variability means choosing a model, naming what each number means, and explaining the strategy.
The goal is not only to get the answer. Students should be able to show the idea, explain the strategy, and check whether the answer makes sense.
Understanding Comparing Populations with Measures of Center and Variability
Before solving, students should slow down and decide what each number, shape, unit, or label represents.
- Read the question carefully and identify what is being asked.
- Choose a model, equation, table, or diagram that matches the situation.
- Solve one step at a time and keep units or labels attached.
- Use the answer explanation to check that the result makes sense.
Visual Models
Visual Model 1
Question: Two basketball teams' free-throw percentages over 10 games are shown below. Based on this data, which statement is most accurate?
| Team | Mean | MAD |
|---|---|---|
| Tigers | 75% | 8% |
| Sharks | 72% | 4% |
- A. The Sharks are more reliable free-throw shooters
- B. The Tigers never miss a free throw
- C. The Sharks score more points overall
- D. Both teams have the same consistency
Why it works: Although Tigers have a higher mean (75% vs.\ 72%), the Sharks have much lower MAD (4% vs.\ 8%), indicating more consistent free-throw shooting.
Answer: The Sharks are more reliable
Visual Model 2
Question: The weights (in pounds) of two dog breeds are recorded: Which breed has more consistent weight?
| Breed A | Breed B |
|---|---|
| 45, 48, 46, 47, 49 | 35, 50, 42, 55, 38 |
- A. Breed A (mean 47, smaller spread)
- B. Breed B (larger sample size)
- C. Both have equal consistency
- D. Cannot determine from the data
Why it works: Breed A ranges from 45--49 (range = 4), while Breed B ranges 35--55 (range = 20). Smaller range indicates greater consistency.
Answer: Breed A has more consistent weight
Worked Examples
Example 1
Question: A teacher recorded the number of minutes students spent on homework: Which class has more variable homework times?
| Class | Median | Range |
|---|---|---|
| Period 1 | 35 min | 20 min |
| Period 2 | 35 min | 60 min |
- A. Period 1
- B. Period 2
- C. Both are equally variable
- D. The data does not support comparison
- Period 2 has a range of 60 minutes, much larger than Period 1's range of 20 minutes, indicating more variability in homework times.
Answer: Period 2
Example 2
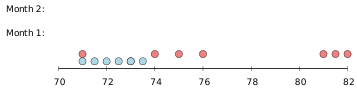
Question: The dot plots below show the daily temperatures (in \(°\)F) for two months: Which month is more consistent in temperature?
- A. Month 1 (tighter cluster)
- B. Month 2 (wider spread)
- C. Both have equal consistency
- D. Cannot tell from dot plots
- Month 1's dots cluster around 71--73\textdegree F (x-coordinates 1--3.5 map to 70--75\textdegree F), a narrow range of 2\textdegree F.
- Month 2's dots span from 71 to 82\textdegree F (x-coordinates 1--12, range \(\approx\) 11\textdegree F).
- Month 1 is more consistent.
Answer: Month 1
Example 3
Question: A coach compared jump heights (in inches) of two volleyball teams: Which team has both a higher center and more consistency?
| Team | Mean | Median | MAD |
|---|---|---|---|
| Team A | 28 | 28 | 2.5 |
| Team B | 26 | 26 | 4.8 |
- A. Team A
- B. Team B
- C. Both are identical
- D. The data is insufficient
- Team A has a higher mean (28 vs.\ 26) and lower MAD (2.5 vs.\ 4.8), meaning both a higher center and more consistent performance.
Answer: Team A
Real-World Word Problems
Problem 1
Question: Store A has a mean daily sales of \($450\) with a MAD of \($30\). Store B has a mean of \($480\) with a MAD of \($90\). Which conclusion is best supported?
- A. Store A typically sells more than Store B
- B. Both stores are equally consistent
- C. Store B typically sells more, but with less consistency
- D. Store B's sales are more predictable due to lower MAD
Why it works: Store B has a higher mean (\($480\) vs.\ \($450\)), indicating higher center. Its larger MAD (\($90\) vs.\ \($30\)) shows greater variability, meaning less consistency. A is false (Store A's mean is lower). B is false (MADs differ). D is false (lower MAD = more predictable, but Store B has higher MAD).
Answer: Store B typically sells more, but with less consistency
Problem 2
Question: Two groups of students took a math test. Group 1: mean = 82, median = 85. Group 2: mean = 82, median = 80. What does this tell us?
- A. Group 1 has higher scores in the upper half
- B. Group 2 performed better overall
- C. Both groups are identical
- D. Group 1 has outliers on the low end
Why it works: Group 1 has mean 82 but median 85. Since median is higher than mean, there are likely some very low scores pulling the mean down (low outliers).
Answer: Group 1 has outliers on the low end
Common Mistakes
- Rushing before identifying what the numbers represent.
- Choosing an operation that does not match the situation.
- Dropping labels, units, or context from the answer.
- Skipping the estimate or reasonableness check.
Strategy Tips
- Underline the question being asked.
- Use a model before jumping to computation.
- Write an equation that matches the story or picture.
- Explain the final answer in a sentence.
Practice Questions
Question 1
Two datasets have the same mean of 50. Dataset X has an IQR of 10. Dataset Y has an IQR of 25. What does this imply?
- A. Dataset X is more spread out
- B. Dataset Y is more spread out in the middle 50%
- C. Both are identical except for outliers
- D. Dataset Y has a smaller range
Question 2
Two grocery stores tracked the number of customers per hour over 5 hours: Which store had more predictable traffic?
| Hour | Store X | Store Y |
|---|---|---|
| 1 | 45 | 52 |
| 2 | 48 | 31 |
| 3 | 47 | 58 |
| 4 | 49 | 44 |
| 5 | 46 | 65 |
- A. Store X (mean 47, less variability)
- B. Store Y (more customers on average means more predictable)
- C. Both are equally predictable
- D. Cannot determine without knowing which store is busier
Question 3
A teacher gives Practice Test 1 and Practice Test 2. Both have a mean of 75. Test 1 has a range of 15 points. Test 2 has a range of 40 points. What conclusion is valid?
- A. Test 2 is harder than Test 1
- B. Test 1 had more consistent performance across students
- C. Students performed identically on both tests
- D. Test 2 is easier
Question 4
Which measure describes how spread out data is?
- A. Mean
- B. Median
- C. Range
- D. Mode
Question 5
A dataset has a mean of 60 and a median of 65. Where are the outliers likely located?
- A. On the high end
- B. On the low end
- C. No outliers are present
- D. Evenly distributed
Question 6
Two runners' mile times (in minutes) are listed. Runner A: 6, 6.2, 6.1, 6, 6.3. Runner B: 5.8, 7.2, 6, 6.1, 5.9. Who is more consistent?
- A. Runner A
- B. Runner B
- C. Both are equally consistent
- D. Cannot determine
Full Answer Explanations Click to show all answers and explanations
Question 1
Answer: Dataset Y is more spread out in the middle 50%
IQR (Interquartile Range) measures the middle 50% of data. Dataset Y's IQR of 25 is larger than Dataset X's IQR of 10, showing greater spread in the middle half.
Question 2
Answer: Store X
Store X: 45, 46, 47, 48, 49 (mean = 47, range = 4, tightly clustered). Store Y: 31, 44, 52, 58, 65 (mean = 50, range = 34, highly variable). Predictability depends on consistency (low variability), not total customer count. Store X's tight clustering makes it far more predictable for planning staffing.
Question 3
Answer: Test 1 had more consistent performance
Test 1's smaller range (15 vs.\ 40) indicates students' scores were closer together, showing more consistent performance despite identical means.
Question 4
Answer: Range
Range (max \(-\) min) measures how spread out data is. Mean, median, and mode measure center, not spread.
Question 5
Answer: On the low end
When mean (60) \(<\) median (65), low outliers pull the mean down, indicating outliers are likely on the low end.
Question 6
Answer: Runner A
Runner A's times range from 6.0 to 6.3 (spread = 0.3). Runner B's range from 5.8 to 7.2 (spread = 1.4). Runner A is more consistent.
Connection to Standards
This lesson supports Grade 7 math expectations for reasoning, modeling, problem solving, and explaining answers clearly. It connects classroom skills to the kind of questions students see on state math assessments.
Summary
Comparing Populations with Measures of Center and Variability becomes easier when students connect the question to a model, use clear steps, and explain why the answer fits.
GOLDEN RULE
Understand the model before choosing the operation.