





Introduction
Graphing Proportional Relationships is an important Grade 7 math skill because students are moving from simple answers toward explaining how the math works.
In this lesson, students use models, real questions, worked examples, practice problems, and two online quizzes to build confidence with graphing proportional relationships.
What Is Graphing Proportional Relationships?
Graphing Proportional Relationships means reading, creating, and explaining displays so data can answer real questions.
The goal is not only to get the answer. Students should be able to show the idea, explain the strategy, and check whether the answer makes sense.
Understanding Graphing Proportional Relationships
Before solving, students should slow down and decide what each number, shape, unit, or label represents.
- Read the title, labels, and scale before answering.
- Use the scale value instead of counting marks as ones when the graph is scaled.
- Compare categories by subtracting or adding values from the display.
- Explain what the data shows in a complete sentence.
Visual Models
Visual Model 1
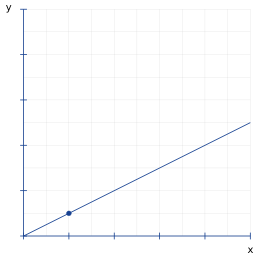
Question: The graph shows a proportional relationship. What is the unit rate (the value of \(y\) at \(x=1\))?
- A. \(5\)
- B. \(1\)
- C. \(2\)
- D. \(0.5\)
Why it works: A proportional relationship passes through the origin. The marked point is \((2,1)\), so the unit rate \(k = 1/2 = 0.5\). The line equation is \(y = 0.5x\).
Answer: \(0.5\)
Visual Model 2
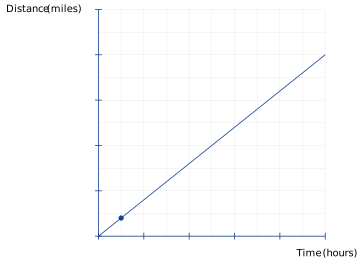
Question: A car drives at a constant speed shown by this graph with unit-rate point \((1, 0.8)\). Which equation represents this relationship?
- A. \(y = 8x\)
- B. \(y = 1.25x\)
- C. \(y = 5x\)
- D. \(y = 0.8x\)
Why it works: The unit-rate point \((1, 0.8)\) shows \(k = 0.8\), so the equation is \(y = 0.8x\).
Answer: \(y = 0.8x\)
Worked Examples
Example 1
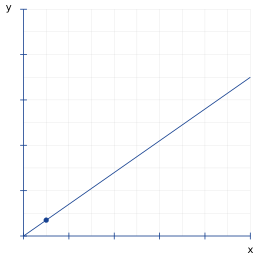
Question: Which equation represents this proportional relationship?
- A. \(y = 10x\)
- B. \(y = 1.4x\)
- C. \(y = 7x\)
- D. \(y = 0.7x\)
- The unit-rate marker at \((1, 0.7)\) shows \(k = 0.7\).
- So the equation is \(y = 0.7x\).
Answer: \(y = 0.7x\)
Example 2
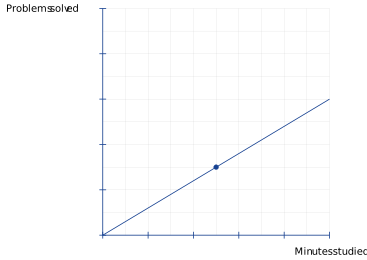
Question: A student solves math problems at a constant rate. The graph shows the relationship between minutes studied and problems solved. How many problems are solved in 15 minutes?
- A. \(6\) problems
- B. \(15\) problems
- C. \(12\) problems
- D. \(9\) problems
- From the marked point \((5,3)\), the unit rate is \(3 \div 5 = 0.6\) problems per minute.
- At \(x = 15\), \(y = 15 \times 0.6 = 9\) problems.
Answer: \(9\) problems
Example 3
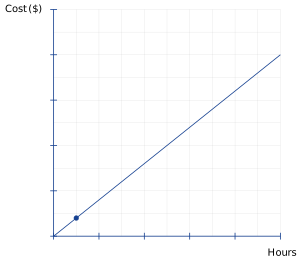
Question: A plumber charges a constant hourly rate, shown by this graph. What is the hourly rate in dollars per hour?
- A. \($0.80\) per hour
- B. \($1.60\) per hour
- C. \($8.00\) per hour
- D. \($10.00\) per hour
- The unit-rate point \((1, 0.8)\) represents the rate at 1 hour, so the hourly rate is \($0.80\) per hour.
- Option B (\($1.60\)) is a distractor for students who double the marked value.
Answer: \($0.80\) per hour
Real-World Word Problems
Problem 1
Question: The graph shows a proportional relationship between hours worked and dollars earned. It passes through the origin and the point \((2,30)\). What is the unit rate (dollars per hour)?
- A. \($2\) per hour
- B. \($60\) per hour
- C. \($28\) per hour
- D. \($15\) per hour
Why it works: The unit rate is the \(y\)-value when \(x=1\). Because \((2,30)\) is on the line through the origin, \(k=30/2=15\), so earning rate is \($15\) per hour.
Answer: \($15\) per hour
Problem 2
Question: Maya runs at a constant speed. The relationship between distance (miles) and time (hours) is proportional and passes through \((3, 18)\). How far does she run per hour?
- A. \(3\) miles per hour
- B. \(54\) miles per hour
- C. \(15\) miles per hour
- D. \(6\) miles per hour
Why it works: From the point \((3,18)\), the unit rate is \(18 \div 3 = 6\) miles per hour.
Answer: \(6\) miles per hour
Common Mistakes
- Ignoring the graph scale.
- Reading the wrong category or axis label.
- Answering a comparison question without subtracting.
- Writing a number without explaining what it represents.
Strategy Tips
- Circle the scale before using the graph.
- Write down the value for each category you compare.
- Use addition for totals and subtraction for differences.
- Answer in words so the data result has meaning.
Practice Questions
Question 1
A recipe for lemonade uses a constant ratio of sugar to water. The graph shows a proportional relationship that passes through the point \((4,6)\), where \(x\) = cups of sugar and \(y\) = cups of water. How many cups of water are needed for 8 cups of sugar?
- A. \(6\) cups
- B. \(8\) cups
- C. \(10\) cups
- D. \(12\) cups
Question 2
A book club orders books in bulk at a constant price per book. If 10 books cost \($120\), how much do 15 books cost?
- A. \($80\)
- B. \($120\)
- C. \($180\)
- D. \($1200\)
Question 3
A store sells apples at a constant unit price. A customer buys 6 apples for \($4.50\). How much does one apple cost?
- A. \($0.50\)
- B. \($2.25\)
- C. \($1.50\)
- D. \($0.75\)
Question 4
A manufacturing plant produces widgets at a constant rate. In 8 hours, 240 widgets are produced. How many widgets are produced per hour?
- A. \(20\) widgets per hour
- B. \(1920\) widgets per hour
- C. \(240\) widgets per hour
- D. \(30\) widgets per hour
Question 5
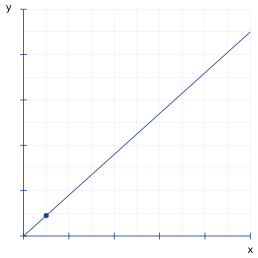
Based on the graph, what is the value of \(y\) when \(x = 5\)?
- A. \(0.9\)
- B. \(9\)
- C. \(5\)
- D. \(4.5\)
Question 6
A streaming service charges a monthly subscription at a constant rate. For 3 months, the cost is \($36\). What is the monthly charge?
- A. \($3\)
- B. \($108\)
- C. \($36\)
- D. \($12\)
Full Answer Explanations Click to show all answers and explanations
Question 1
Answer: \(12\) cups
The unit rate is \(6 \div 4 = 1.5\). So \(y = 1.5x\). At \(x = 8\), \(y = 1.5 \times 8 = 12\) cups.
Question 2
Answer: \($180\)
Unit rate is \($120 \div 10 = $12\) per book. For 15 books: \(15 \times $12 = $180\).
Question 3
Answer: \($0.75\)
Unit price = \($4.50 \div 6 = $0.75\) per apple.
Question 4
Answer: \(30\) widgets per hour
Unit rate = \(240 \div 8 = 30\) widgets per hour.
Question 5
Answer: \(4.5\)
The unit rate is \(0.9\) (from the point \((1, 0.9)\)). When \(x = 5\), \(y = 5 \times 0.9 = 4.5\).
Question 6
Answer: \($12\)
Unit rate = \($36 \div 3 = $12\) per month.
Connection to Standards
This lesson supports Grade 7 math expectations for reasoning, modeling, problem solving, and explaining answers clearly. It connects classroom skills to the kind of questions students see on state math assessments.
Summary
Graphing Proportional Relationships becomes easier when students connect the question to a model, use clear steps, and explain why the answer fits.
GOLDEN RULE
Read the scale before reading the answer.