
Grades 6-12Free, no account needed
Five-number summary & boxplot calculator
Find exact median-of-halves quartiles, IQR, fences and outliers, and connect the five-number summary to a modified boxplot.
Try your problem
Supported inputs and limits
Use 2-20 comma-separated observations. Median-of-halves only, excluding the overall median for odd n; no quartile-method selector or percentile interpolation. Includes exact IQR, 1.5-IQR fences and strict outside-fence outliers. Boxplot axes are centered at the exact median before approximate projection. Scalars are signed integers, decimals with 1-6 decimal places, or integer fractions with positive denominator, at most 24 characters and 12 digits per integer part. Magnitude at most 1000000 and reduced denominator at most 1000000. No expressions, mixed numbers, repeating decimals, percent signs or scientific notation. Lists have at most 520 characters. All numerical answers and table values are exact rationals; diagram positions alone are approximate. Named paste commands are case-sensitive and at most 200 characters.
Step by step
Understand the method
Sort every observation, keeping repeated values. The five-number summary is the minimum, first quartile Q1, median M, third quartile Q3 and maximum. For an even number of observations, a median averages the middle pair.
This calculator defines Q1 and Q3 as medians of the lower and upper halves. When n is odd, exclude the overall median from both halves. Quartile conventions differ; an interpolating spreadsheet method may give a different answer without an arithmetic error.
The interquartile range is Q3 - Q1. Tukey fences are Q1 - 1.5 IQR and Q3 + 1.5 IQR. Values strictly outside are flagged as outliers. A modified boxplot puts whiskers at the extreme non-outliers, while the summary still reports the actual minimum and maximum. Zero IQR is valid and can coexist with outliers.
Worked examples
Read the reasoning, or load an example into the calculator.
Odd sample, excluded median
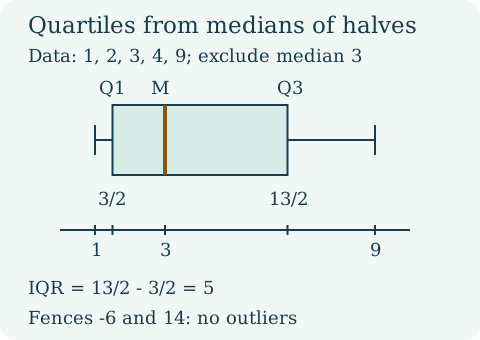
Sorted 1,2,3,4,9 has median 3. Excluding it gives halves 1,2 and 4,9, so Q1=3/2 and Q3=13/2. IQR=5; no value is outside fences -6 and 14.
Even sample with fractions
For -1,0,1/2,3/2, median=(0+1/2)/2=1/4. Lower-half median=-1/2; upper-half median=1. The summary is -1,-1/2,1/4,1,3/2.
Zero IQR with a real outlier
For six 1s and one 9, both quartiles and the median are 1. IQR=0 makes both fences 1, so 9 is an outlier. Both whiskers are 1 but the actual maximum is 9.
Try it without the calculator
Three questions for practice, not a graded school assessment. Your answers stay on this page and are not saved.
Original Testinar learning content. This local preview is awaiting final review before publication.