CH05-04 lesson

Measurement Data and Line Plots Learning Activity

A focused Grade 3 learning session for Measurement Data and Line Plots using visual models, worked examples, strategy guidance, and a short mastery check.

15
minutes
6
lesson parts
11
practice items
Learning goal

Students will organize measurement data on line plots marked in whole, half, and quarter units.

Student goal: I can represent and interpret measurement data on a line plot.

concept

Learn the Idea

Measurement Data and Line Plots means reading, creating, and explaining displays so data can answer real questions.

  • Read the title, labels, and scale before answering.
  • Use the scale value instead of counting marks as ones when the graph is scaled.
  • Compare categories by subtracting or adding values from the display.
  • Explain what the data shows in a complete sentence.
visual model

See the Math

Visual Model 1

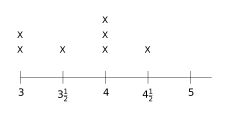
Question: This line plot shows ribbon lengths in inches. The scale goes by halves: \(3, 3\frac{1}{2}, 4, 4\frac{1}{2}, 5\). How many ribbons are \(4\) inches long?

Grade 3 Measurement Data and Line Plots figure 1

  • A. \(2\)
  • B. \(3\)
  • C. \(4\)
  • D. \(5\)

Why it works: Count the X's directly above the \(4\)-inch mark. There are three X's stacked there.

Answer: \(3\) ribbons

worked example

Follow a Worked Example

Example 1

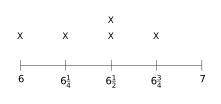
Question: A line plot shows fish tank measurements in inches using quarters: \(6, 6\frac{1}{4}, 6\frac{1}{2}, 6\frac{3}{4}, 7\). How many measurements in total?

Grade 3 Measurement Data and Line Plots figure 3

  • A. \(5\)
  • B. \(6\)
  • C. \(4\)
  • D. \(7\)
  1. Count all the X's: one at \(6\), one at \(6\frac{1}{4}\), two at \(6\frac{1}{2}\), one at \(6\frac{3}{4}\).
  2. Total is \(5\).

Answer: \(5\) measurements

Example 2

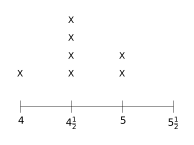
Question: Mia recorded the weights of apples in ounces. The line plot shows: \(4, 4\frac{1}{2}, 5, 5\frac{1}{2}\). Which weight has the least X's?

Grade 3 Measurement Data and Line Plots figure 4

  • A. \(4\) ounces
  • B. \(4\frac{1}{2}\) ounces
  • C. \(5\) ounces
  • D. \(5\frac{1}{2}\) ounces
  1. At \(5\frac{1}{2}\), there are zero X's.
  2. All other values have at least one X.

Answer: \(5\frac{1}{2}\) ounces

real world

Connect It to a Real Situation

Problem 1

Question: A line plot shows the lengths of \(10\) pencils to the nearest \(\frac{1}{4}\) inch. There are three X's above \(4\frac{1}{2}\) inches. What does this mean?

  • A. \(3\) pencils are \(4\frac{1}{2}\) inches long
  • B. \(3\) is added to \(4\frac{1}{2}\)
  • C. \(\frac{1}{2}\) of the pencils are \(3\) inches
  • D. \(3\) pencils total

Why it works: Each X represents one measurement. Three X's above \(4\frac{1}{2}\) means three pencils have that length.

Answer: \(3\) pencils are \(4\frac{1}{2}\) inches long

strategy

Avoid Mistakes and Choose a Strategy

  • Ignoring the graph scale.
  • Reading the wrong category or axis label.
  • Answering a comparison question without subtracting.
  • Writing a number without explaining what it represents.
  • Circle the scale before using the graph.
  • Write down the value for each category you compare.
  • Use addition for totals and subtraction for differences.
  • Answer in words so the data result has meaning.
summary

Remember the Key Idea

Measurement Data and Line Plots becomes easier when students connect the question to a model, use clear steps, and explain why the answer fits.

GOLDEN RULE

Read the scale before reading the answer.

Guided to independent practice

Solve before opening the answer

Use scratch paper. The explanation matters more than simply seeing whether the choice is correct.

warmup

2 questions
G3-C05-T04-Q001 About 1 min

A line plot shows the lengths of \(10\) pencils to the nearest \(\frac{1}{4}\) inch. There are three X's above \(4\frac{1}{2}\) inches. What does this mean?

  1. A \(3\) pencils are \(4\frac{1}{2}\) inches long
  2. B \(3\) is added to \(4\frac{1}{2}\)
  3. C \(\frac{1}{2}\) of the pencils are \(3\) inches
  4. D \(3\) pencils total
Check answer and explanation

Answer A: \(3\) pencils are \(4\frac{1}{2}\) inches long

Each X represents one measurement. Three X's above \(4\frac{1}{2}\) means three pencils have that length.

G3-C05-T04-Q002 About 1 min

This line plot shows ribbon lengths in inches. The scale goes by halves: \(3, 3\frac{1}{2}, 4, 4\frac{1}{2}, 5\). How many ribbons are \(4\) inches long?

Measurement Data and Line Plots visual for G3-C05-T04-Q002
  1. A \(2\)
  2. B \(3\)
  3. C \(4\)
  4. D \(5\)
Check answer and explanation

Answer B: \(3\)

Count the X's directly above the \(4\)-inch mark. There are three X's stacked there.

guided

1 question
G3-C05-T04-Q003 About 1 min

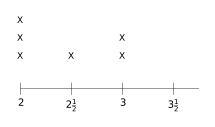
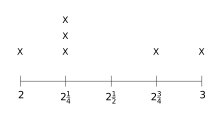
Sam measured the heights of flower stems in inches. The line plot below shows halves: \(2, 2\frac{1}{2}, 3, 3\frac{1}{2}\). What is the most common stem height?

Measurement Data and Line Plots visual for G3-C05-T04-Q003
  1. A \(2\) inches
  2. B \(2\frac{1}{2}\) inches
  3. C \(3\) inches
  4. D \(3\frac{1}{2}\) inches
Check answer and explanation

Answer A: \(2\) inches

The value with the most X's is the mode. At \(2\) inches, there are \(3\) X's. This is more than any other value.

practice

5 questions
G3-C05-T04-Q004 About 1 min

A line plot shows fish tank measurements in inches using quarters: \(6, 6\frac{1}{4}, 6\frac{1}{2}, 6\frac{3}{4}, 7\). How many measurements in total?

Measurement Data and Line Plots visual for G3-C05-T04-Q004
  1. A \(5\)
  2. B \(6\)
  3. C \(4\)
  4. D \(7\)
Check answer and explanation

Answer A: \(5\)

Count all the X's: one at \(6\), one at \(6\frac{1}{4}\), two at \(6\frac{1}{2}\), one at \(6\frac{3}{4}\). Total is \(5\).

G3-C05-T04-Q005 About 1 min

Mia recorded the weights of apples in ounces. The line plot shows: \(4, 4\frac{1}{2}, 5, 5\frac{1}{2}\). Which weight has the least X's?

Measurement Data and Line Plots visual for G3-C05-T04-Q005
  1. A \(4\) ounces
  2. B \(4\frac{1}{2}\) ounces
  3. C \(5\) ounces
  4. D \(5\frac{1}{2}\) ounces
Check answer and explanation

Answer D: \(5\frac{1}{2}\) ounces

At \(5\frac{1}{2}\), there are zero X's. All other values have at least one X.

G3-C05-T04-Q006 About 1 min

A line plot shows book page counts: \(50, 50\frac{1}{2}, 51, 51\frac{1}{2}, 52\) pages. There are two X's at \(50\) pages, one X at \(50\frac{1}{2}\) pages, four X's at \(51\) pages, one X at \(51\frac{1}{2}\) pages, and one X at \(52\) pages. Which page count appears the least often?

  1. A \(50\) pages
  2. B \(50\frac{1}{2}\) pages
  3. C \(51\) pages
  4. D \(52\) pages
Check answer and explanation

Answer B: \(50\frac{1}{2}\) pages

Both \(50\frac{1}{2}\) and \(52\) pages have only \(1\) X each, but \(50\frac{1}{2}\) is one of the least common. The next most common is \(50\) pages with \(2\) X's, and \(51\) pages appears most often with \(4\) X's.

G3-C05-T04-Q007 About 1 min

Emma measured twig lengths in inches. At the \(4\) inch mark, there are \(5\) X's. At the \(4\frac{1}{4}\) inch mark, there are \(3\) X's. How many more twigs are exactly \(4\) inches long than \(4\frac{1}{4}\) inches long?

  1. A \(1\)
  2. B \(2\)
  3. C \(3\)
  4. D \(8\)
Check answer and explanation

Answer B: \(2\)

Subtract: \(5 - 3 = 2\) more twigs are \(4\) inches long.

G3-C05-T04-Q008 About 1 min

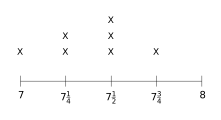
A line plot shows paintbrush lengths in inches: \(7, 7\frac{1}{4}, 7\frac{1}{2}, 7\frac{3}{4}, 8\). What is the most common paintbrush length?

Measurement Data and Line Plots visual for G3-C05-T04-Q008
  1. A \(7\) inches
  2. B \(7\frac{1}{4}\) inches
  3. C \(7\frac{1}{2}\) inches
  4. D \(7\frac{3}{4}\) inches
Check answer and explanation

Answer C: \(7\frac{1}{2}\) inches

At \(7\frac{1}{2}\), there are \(3\) X's. This is more than at any other length.

exit

3 questions
G3-C05-T04-Q009 About 1 min

A line plot shows toy car weights in ounces with quarter marks: \(2, 2\frac{1}{4}, 2\frac{1}{2}, 2\frac{3}{4}, 3\). How many toy cars weigh at most \(2\frac{1}{2}\) ounces?

Measurement Data and Line Plots visual for G3-C05-T04-Q009
  1. A \(3\)
  2. B \(4\)
  3. C \(5\)
  4. D \(6\)
Check answer and explanation

Answer B: \(4\)

At most \(2\frac{1}{2}\) includes weights of \(2\), \(2\frac{1}{4}\), and \(2\frac{1}{2}\) ounces. The plot has \(1+3+0=4\) X's at those values.

G3-C05-T04-Q010 About 1 min

A line plot shows eraser weights in grams: \(10, 10\frac{1}{2}, 11, 11\frac{1}{2}\). At \(10\) grams there are \(2\) X's. At \(10\frac{1}{2}\) there are \(4\) X's. At \(11\) there are \(2\) X's. How many erasers total?

  1. A \(6\)
  2. B \(8\)
  3. C \(10\)
  4. D \(12\)
Check answer and explanation

Answer B: \(8\)

Add: \(2 + 4 + 2 = 8\) erasers total.

G3-C05-T04-Q011 About 1 min

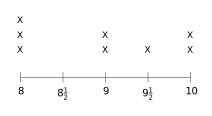
Lily made a line plot of marble diameters in millimeters using halves: \(8, 8\frac{1}{2}, 9, 9\frac{1}{2}, 10\). Which marble size appears least often?

Measurement Data and Line Plots visual for G3-C05-T04-Q011
  1. A \(8\) mm
  2. B \(8\frac{1}{2}\) mm
  3. C \(9\frac{1}{2}\) mm
  4. D \(10\) mm
Check answer and explanation

Answer B: \(8\frac{1}{2}\) mm

At \(8\frac{1}{2}\) there are no X's, so it appears least often.

Page UP