CH01-05 lesson

Graphing Proportional Relationships Learning Activity

A focused Grade 7 learning session for Graphing Proportional Relationships using visual models, worked examples, strategy guidance, and a short mastery check.

18
minutes
6
lesson parts
11
practice items
Learning goal

Students will build Grade 7 mastery of graphing proportional relationships using models, equations, and test-style reasoning.

Student goal: I can solve problems involving graphing proportional relationships.

concept

Learn the Idea

Graphing Proportional Relationships is part of Grade 7 Ratios and Proportional Relationships. This activity focuses on the central idea students need before they move into independent practice.

Students will build Grade 7 mastery of graphing proportional relationships using models, equations, and test-style reasoning.

visual model

See the Math

What to noticeHow to use it
Numbers, units, labels, diagrams, or graphsIdentify what each part represents before calculating.
The relationship in the problemConnect the model to an equation, comparison, or explanation.

Use the figures and worked questions in the practice set below as the visual model for this skill.

worked example

Follow a Worked Example

Read the first practice question slowly. Decide what the question is asking, choose a strategy, solve, and then compare your reasoning with the answer explanation.

For Graphing Proportional Relationships, a strong worked example should show the setup, the calculation or model, and a final answer that matches the context.

real world

Connect It to a Real Situation

Many Grade 7 test questions use real situations. Look for quantities, units, rates, measures, expressions, or data values that connect the math to the story.

After solving, explain what the answer means in the situation, not just the number you calculated.

strategy

Avoid Mistakes and Choose a Strategy

  • Underline the exact question before solving.
  • Label units, variables, or graph axes when they appear.
  • Estimate first so unreasonable answers are easier to catch.
  • Review missed questions and write the reason for each mistake.
summary

Remember the Key Idea

I can solve problems involving graphing proportional relationships.

Use the warmup, guided question, practice set, and exit questions below to check whether this skill is ready or needs more practice.

Guided to independent practice

Solve before opening the answer

Use scratch paper. The explanation matters more than simply seeing whether the choice is correct.

warmup

2 questions
G7-C01-T05-Q001 About 1 min

The graph shows a proportional relationship between hours worked and dollars earned. It passes through the origin and the point \((2,30)\). What is the unit rate (dollars per hour)?

  1. A \($2\) per hour
  2. B \($60\) per hour
  3. C \($28\) per hour
  4. D \($15\) per hour
Check answer and explanation

Answer D: \($15\) per hour

The unit rate is the \(y\)-value when \(x=1\). Because \((2,30)\) is on the line through the origin, \(k=30/2=15\), so earning rate is \($15\) per hour.
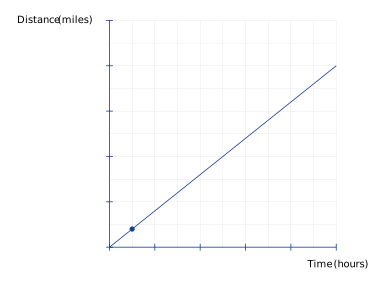
G7-C01-T05-Q002 About 1 min

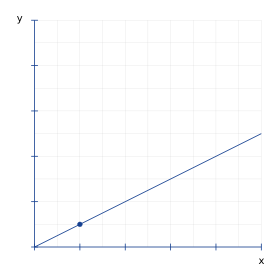
The graph shows a proportional relationship. What is the unit rate (the value of \(y\) at \(x=1\))?

Graphing Proportional Relationships visual for G7-C01-T05-Q002
  1. A \(5\)
  2. B \(1\)
  3. C \(2\)
  4. D \(0.5\)
Check answer and explanation

Answer D: \(0.5\)

A proportional relationship passes through the origin. The marked point is \((2,1)\), so the unit rate \(k = 1/2 = 0.5\). The line equation is \(y = 0.5x\).

guided

1 question
G7-C01-T05-Q003 About 1 min

Maya runs at a constant speed. The relationship between distance (miles) and time (hours) is proportional and passes through \((3, 18)\). How far does she run per hour?

  1. A \(3\) miles per hour
  2. B \(54\) miles per hour
  3. C \(15\) miles per hour
  4. D \(6\) miles per hour
Check answer and explanation

Answer D: \(6\) miles per hour

From the point \((3,18)\), the unit rate is \(18 \div 3 = 6\) miles per hour.

practice

5 questions
G7-C01-T05-Q004 About 1 min

A car drives at a constant speed shown by this graph with unit-rate point \((1, 0.8)\). Which equation represents this relationship?

Graphing Proportional Relationships visual for G7-C01-T05-Q004
  1. A \(y = 8x\)
  2. B \(y = 1.25x\)
  3. C \(y = 5x\)
  4. D \(y = 0.8x\)
Check answer and explanation

Answer D: \(y = 0.8x\)

The unit-rate point \((1, 0.8)\) shows \(k = 0.8\), so the equation is \(y = 0.8x\).

G7-C01-T05-Q005 About 1 min

A recipe for lemonade uses a constant ratio of sugar to water. The graph shows a proportional relationship that passes through the point \((4,6)\), where \(x\) = cups of sugar and \(y\) = cups of water. How many cups of water are needed for 8 cups of sugar?

  1. A \(6\) cups
  2. B \(8\) cups
  3. C \(10\) cups
  4. D \(12\) cups
Check answer and explanation

Answer D: \(12\) cups

The unit rate is \(6 \div 4 = 1.5\). So \(y = 1.5x\). At \(x = 8\), \(y = 1.5 \times 8 = 12\) cups.

G7-C01-T05-Q006 About 1 min

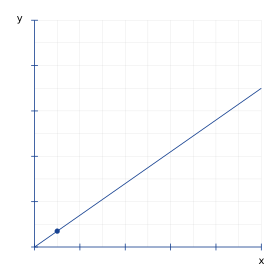
Which equation represents this proportional relationship?

Graphing Proportional Relationships visual for G7-C01-T05-Q006
  1. A \(y = 10x\)
  2. B \(y = 1.4x\)
  3. C \(y = 7x\)
  4. D \(y = 0.7x\)
Check answer and explanation

Answer D: \(y = 0.7x\)

The unit-rate marker at \((1, 0.7)\) shows \(k = 0.7\). So the equation is \(y = 0.7x\).

G7-C01-T05-Q007 About 1 min

A book club orders books in bulk at a constant price per book. If 10 books cost \($120\), how much do 15 books cost?

  1. A \($80\)
  2. B \($120\)
  3. C \($180\)
  4. D \($1200\)
Check answer and explanation

Answer C: \($180\)

Unit rate is \($120 \div 10 = $12\) per book. For 15 books: \(15 \times $12 = $180\).

G7-C01-T05-Q008 About 1 min

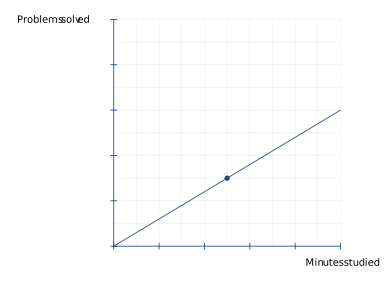
A student solves math problems at a constant rate. The graph shows the relationship between minutes studied and problems solved. How many problems are solved in 15 minutes?

Graphing Proportional Relationships visual for G7-C01-T05-Q008
  1. A \(6\) problems
  2. B \(15\) problems
  3. C \(12\) problems
  4. D \(9\) problems
Check answer and explanation

Answer D: \(9\) problems

From the marked point \((5,3)\), the unit rate is \(3 \div 5 = 0.6\) problems per minute. At \(x = 15\), \(y = 15 \times 0.6 = 9\) problems.

exit

3 questions
G7-C01-T05-Q009 About 1 min

A store sells apples at a constant unit price. A customer buys 6 apples for \($4.50\). How much does one apple cost?

  1. A \($0.50\)
  2. B \($2.25\)
  3. C \($1.50\)
  4. D \($0.75\)
Check answer and explanation

Answer D: \($0.75\)

Unit price = \($4.50 \div 6 = $0.75\) per apple.

G7-C01-T05-Q010 About 1 min

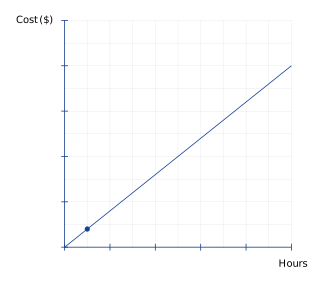
A plumber charges a constant hourly rate, shown by this graph. What is the hourly rate in dollars per hour?

Graphing Proportional Relationships visual for G7-C01-T05-Q010
  1. A \($0.80\) per hour
  2. B \($1.60\) per hour
  3. C \($8.00\) per hour
  4. D \($10.00\) per hour
Check answer and explanation

Answer A: \($0.80\) per hour

The unit-rate point \((1, 0.8)\) represents the rate at 1 hour, so the hourly rate is \($0.80\) per hour. Option B (\($1.60\)) is a distractor for students who double the marked value.

G7-C01-T05-Q011 About 1 min

A manufacturing plant produces widgets at a constant rate. In 8 hours, 240 widgets are produced. How many widgets are produced per hour?

  1. A \(20\) widgets per hour
  2. B \(1920\) widgets per hour
  3. C \(240\) widgets per hour
  4. D \(30\) widgets per hour
Check answer and explanation

Answer D: \(30\) widgets per hour

Unit rate = \(240 \div 8 = 30\) widgets per hour.

Page UP