

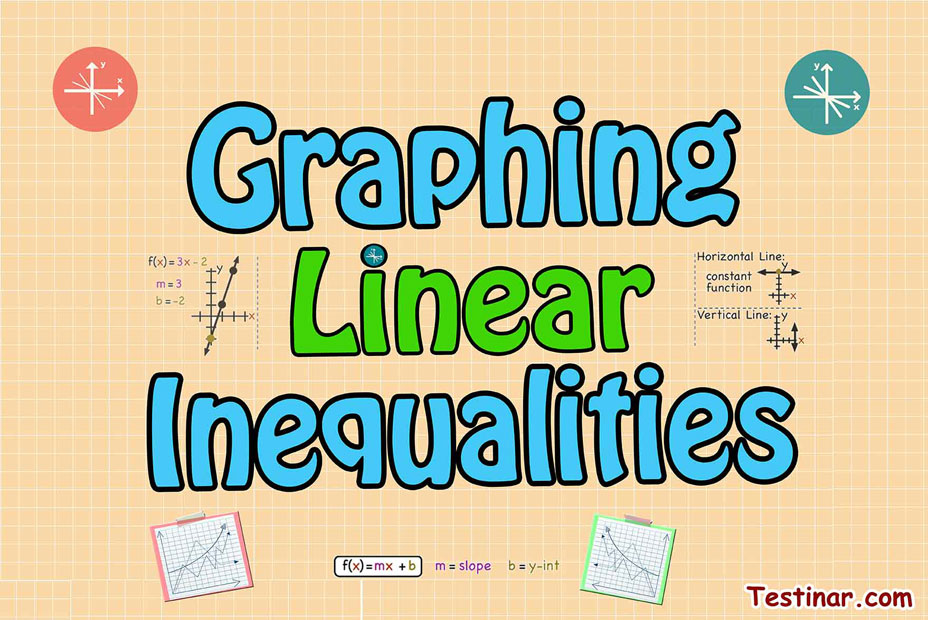
How to Graph Linear Inequalities?
Read,5 minutes
A linear inequality describes a half-plane: one side of a boundary line. The boundary comes from replacing the inequality sign with an equals sign.
Boundary Lines
Use a solid line for \(\le\) or \(\ge\), because points on the line are included. Use a dashed line for \(\lt\) or \(\gt\), because points on the line are not included.
Shading
For \(y>mx+b\), shade above the line. For \(y<mx+b\), shade below the line. For vertical inequalities, shade right for \(x>a\) and left for \(x<a\). A test point such as \((0,0)\) can confirm the correct side.
Example
To graph \(y\le 2x+1\), draw the solid boundary line \(y=2x+1\), then shade below it because the inequality says \(y\) is less than or equal to the line's value.
Graphing Linear Inequalities
Think of this lesson as more than a rule to memorize. Graphing Linear Inequalities is about rate of change, slope, intercepts, and coordinate patterns. A strong student does not rush to the first formula on the page; they pause, identify the structure of the problem, and then choose the tool that matches that structure. That pause is what prevents most mistakes.
An inequality compares sizes. Solve it like an equation, but remember that multiplying or dividing by a negative number reverses the inequality sign.
Here is the teacher way to approach the topic. First, read the problem slowly and underline the information that is actually given. Next, name the target: are you finding a value, simplifying an expression, comparing two quantities, solving for a variable, or interpreting a graph? Once the target is clear, the calculation becomes much less mysterious because every step has a job.
- Clear clutter such as parentheses or fractions.
- Collect like terms.
- Undo operations in reverse order.
- Substitute the answer back or test a point.
A helpful habit is to say what each number represents before using it. For example, if a number is a denominator, a radius, a slope, a common difference, or a coefficient, it should not be treated like an ordinary loose number. Its role tells you where it belongs in the formula. This is especially important on ACT-style questions because many wrong answer choices come from using the right numbers in the wrong places.
Another good habit is to keep the work organized vertically. Write one clean line for substitution, one line for simplifying, and one line for the final answer. If the problem has units, keep the units attached. If the problem has signs, exponents, or parentheses, copy them carefully from one line to the next. Most errors in this topic are not caused by a hard idea; they are caused by dropping a negative sign, combining unlike terms, using the wrong denominator, or skipping a check.
When you finish, ask a quick reasonableness question. Should the answer be positive or negative? Should it be larger or smaller than the original number? Does it fit the graph, table, shape, or equation? Can you plug it back into the original problem? This final check turns the lesson from a procedure into understanding.
On a test, the goal is not to write the longest solution. The goal is to write enough clear work that you can see the structure, avoid traps, and recover quickly if one line goes wrong. Practice the examples below with that mindset: identify the type of problem, choose the matching rule, show the substitution, simplify carefully, and check the answer before moving on.
Exercises for Graphing Linear Inequalities
1) Graph the inequality \(y \lt 2x+3\).
2) Graph the inequality \(y \ge -x+4\).
3) Graph the inequality \(y \gt \frac{1}{2}x-2\).
4) Graph the inequality \(y \le -3x-1\).
5) Graph the inequality \(y \lt 5\).
6) Graph the inequality \(x \ge -2\).
7) Graph the inequality \(y \gt -4\).
8) Graph the inequality \(x \lt 3\).
9) Graph the inequality \(y \le \frac{2}{3}x+1\).
10) Graph the inequality \(y \ge -\frac{3}{2}x+6\).
11) Graph the inequality \(y \lt -x-5\).
12) Graph the inequality \(y \gt 4x\).
13) Graph the inequality \(y \le x-7\).
14) Graph the inequality \(y \ge \frac{1}{4}x-3\).
15) Graph the inequality \(y \lt -\frac{5}{2}x+2\).
16) Graph the inequality \(x \le 0\).
17) Graph the inequality \(y \gt -2x+8\).
18) Graph the inequality \(y \le -1\).
19) Graph the inequality \(y \ge 3x-9\).
20) Graph the inequality \(x \gt -5\).
1) Graph the boundary line \(y=2x+3\). Because the symbol is \(\lt\), draw a dashed boundary. Since \(y\) is less than \(2x+3\), shade the region below the line. Check with a test point if needed.
2) Graph the boundary line \(y=-x+4\). Because the symbol is \(\ge\), draw a solid boundary. Since \(y\) is greater than or equal to \(-x+4\), shade the region above the line. Check with a test point if needed.
3) Graph the boundary line \(y=\frac{1}{2}x-2\). Because the symbol is \(\gt\), draw a dashed boundary. Since \(y\) is greater than \(\frac{1}{2}x-2\), shade the region above the line. Check with a test point if needed.
4) Graph the boundary line \(y=-3x-1\). Because the symbol is \(\le\), draw a solid boundary. Since \(y\) is less than or equal to \(-3x-1\), shade the region below the line. Check with a test point if needed.
5) Graph the boundary line \(y=5\). Because the symbol is \(\lt\), draw a dashed boundary. Since \(y\) is less than \(5\), shade the region below the line. Check with a test point if needed.
6) Graph the vertical boundary line \(x=-2\). Because the symbol is \(\ge\), draw a solid boundary. Shade the region to the right of the line, which contains all points whose \(x\)-values satisfy the inequality.
7) Graph the boundary line \(y=-4\). Because the symbol is \(\gt\), draw a dashed boundary. Since \(y\) is greater than \(-4\), shade the region above the line. Check with a test point if needed.
8) Graph the vertical boundary line \(x=3\). Because the symbol is \(\lt\), draw a dashed boundary. Shade the region to the left of the line, which contains all points whose \(x\)-values satisfy the inequality.
9) Graph the boundary line \(y=\frac{2}{3}x+1\). Because the symbol is \(\le\), draw a solid boundary. Since \(y\) is less than or equal to \(\frac{2}{3}x+1\), shade the region below the line. Check with a test point if needed.
10) Graph the boundary line \(y=-\frac{3}{2}x+6\). Because the symbol is \(\ge\), draw a solid boundary. Since \(y\) is greater than or equal to \(-\frac{3}{2}x+6\), shade the region above the line. Check with a test point if needed.
11) Graph the boundary line \(y=-x-5\). Because the symbol is \(\lt\), draw a dashed boundary. Since \(y\) is less than \(-x-5\), shade the region below the line. Check with a test point if needed.
12) Graph the boundary line \(y=4x\). Because the symbol is \(\gt\), draw a dashed boundary. Since \(y\) is greater than \(4x\), shade the region above the line. Check with a test point if needed.
13) Graph the boundary line \(y=x-7\). Because the symbol is \(\le\), draw a solid boundary. Since \(y\) is less than or equal to \(x-7\), shade the region below the line. Check with a test point if needed.
14) Graph the boundary line \(y=\frac{1}{4}x-3\). Because the symbol is \(\ge\), draw a solid boundary. Since \(y\) is greater than or equal to \(\frac{1}{4}x-3\), shade the region above the line. Check with a test point if needed.
15) Graph the boundary line \(y=-\frac{5}{2}x+2\). Because the symbol is \(\lt\), draw a dashed boundary. Since \(y\) is less than \(-\frac{5}{2}x+2\), shade the region below the line. Check with a test point if needed.
16) Graph the vertical boundary line \(x=0\). Because the symbol is \(\le\), draw a solid boundary. Shade the region to the left of the line, which contains all points whose \(x\)-values satisfy the inequality.
17) Graph the boundary line \(y=-2x+8\). Because the symbol is \(\gt\), draw a dashed boundary. Since \(y\) is greater than \(-2x+8\), shade the region above the line. Check with a test point if needed.
18) Graph the boundary line \(y=-1\). Because the symbol is \(\le\), draw a solid boundary. Since \(y\) is less than or equal to \(-1\), shade the region below the line. Check with a test point if needed.
19) Graph the boundary line \(y=3x-9\). Because the symbol is \(\ge\), draw a solid boundary. Since \(y\) is greater than or equal to \(3x-9\), shade the region above the line. Check with a test point if needed.
20) Graph the vertical boundary line \(x=-5\). Because the symbol is \(\gt\), draw a dashed boundary. Shade the region to the right of the line, which contains all points whose \(x\)-values satisfy the inequality.
<
Graphing Linear Inequalities Quiz
More Linear Functions courses
QMARK) How to find the midpoint of a line
QMARK) How To Graph Lines Using Line Equation
QMARK) How to Graph Linear Inequalities
QMARK) How to Graph Lines Using Standard Form
QMARK) How to Graph Lines by Using Slope–Intercept Form
QMARK) How to Write Linear Equations